
Figure 4.
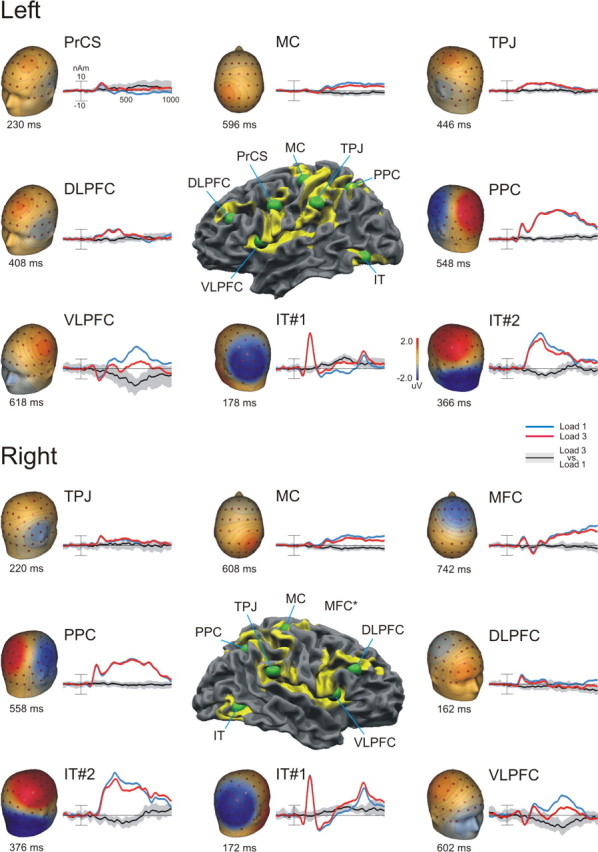
Time courses of the regional source activity. Positions of the regional sources on the fMRI activation maps (middle) surrounded by the source activities and their corresponding topographical voltage maps are shown. Source time courses are shown in blue for load 1 and in red for load 3. The black line represents the difference wave form, with the area shaded in gray denoting the 95% confidence interval as determined by the bootstrap BCa method (see Materials and Methods).