Abstract
Bats quickly navigate through a highly structured environment relying on echolocation. Large natural objects in the environment, like bushes or trees, produce complex stochastic echoes, which can be characterized by the echo roughness. Previous work has shown that bats can use echo roughness to classify the stochastic properties of natural objects. This study provides both psychophysical and electrophysiological data to identify a neural correlate of statistical echo analysis in the bat Phyllostomus discolor. Psychophysical results show that the bats require a fixed minimum roughness of 2.5 (in units of base 10 logarithm of the stimulus fourth moment) for roughness discrimination. Electrophysiological results reveal a subpopulation of 15 of 94 recorded cortical units, located in an anterior region of auditory cortex, whose rate responses changed significantly with echo roughness. It is shown that the behavioral ability to discriminate differences in the statistics of complex echoes can be quantitatively predicted by the neural responses of this subpopulation of auditory-cortical neurons.
Keywords: echolocation, auditory cortex, roughness, bats, object recognition, psychoacoustics
Introduction
Through echolocation, a bat can determine not only the position of an object in the dark, but also its structural features, which are encoded in the acoustic image of the object within the echo. The acoustic image of an object is defined as the sum of the reflections in response to an acoustic impulse of theoretically infinite shortness and infinite amplitude (Dirac impulse), and is referred to as the impulse response (IR) of the object. Technically, the echo a bat will perceive is the convolution of the bat's sonar emission and the IR. Larger natural objects like trees have a very complex structure with thousands of reflective surfaces which are provided by the leaves and branches. Moreover, this structure (and, thus, its IR) will be highly unstable over time because movements of the leaves caused by wind will occur and a bat will rarely encounter a tree twice from exactly the same angle. Echoes reflected from these surfaces will have no systematic spectral interference pattern. However, a bat should be able to identify natural objects to navigate within complex surroundings or, in the case of frugivorous bats, for the classification of trees that provide food. A comparative analysis of the IRs of two different trees has indicated that the degree of envelope fluctuation of the IRs (i.e., the IR roughness) is a good predictor for the correct association of the IRs to the corresponding tree (Muller and Kuc, 2000). A broad-leafed tree with relatively fewer but larger reflective surfaces will produce a rough IR, whereas the small leaves of a conifer will produce many reflections with low amplitude, resulting in a smooth IR. A free-field study confirmed the high predictive power of the IR roughness for the classification of natural objects (Stilz, 2004).
In a psychophysical playback experiment with phantom objects, Grunwald et al. (2004) showed that the fruit-eating bat Phyllostomus discolor can learn to discriminate echoes generated with a smooth IR from echoes generated with a rough IR, and that once they had learned this discrimination task, P. discolor spontaneously classified unknown IRs according to IR roughness. A functional auditory simulation of these results suggested that modulation-sensitive neurons in the midbrain with best modulation frequencies above ∼80 Hz could provide a neural basis for this performance.
Neural processing of echo roughness has not been studied so far. It is especially interesting to directly relate neural processing to behavioral performance, an attempt that has only been made a few times in bats (Riquimaroux et al., 1991, 1992). Thus, two questions are pursued here: (1) what are the behavioral thresholds for auditory-object discrimination based on IR roughness in P. discolor and (2) is there an auditory cortical correlate of the behavioral performance? The first question is addressed with a psychophysical phantom-object experiment. The second question is addressed with electrophysiological recordings from neurons in the auditory cortex of P. discolor with a stimulation paradigm that closely matches the psychophysical paradigm.
Materials and Methods
Animals
The experimental animal, the lesser spear-nosed bat P. discolor, forages for fruit, nectar, pollen, and insects in a neotropical forest habitat and navigates through highly structured surroundings. P. discolor emits brief (<3 ms), broad-band multiharmonic echolocation calls covering the frequency range between 40 and 90 kHz.
Psychophysics
The psychophysical experiments were implemented as virtual-object playback experiments. The bats were required to evaluate the echoes of their echolocation calls. These echoes were generated by convolving in real time the calls with the acoustic impulse response of a virtual object. Thus, unlike in classical psychoacoustic experiments, the bats did not hear sounds unless they emitted echolocation calls.
Four female bats were used for the psychophysics. All four animals were housed together with access to water ad libitum, except during individual training sessions. Training sessions were usually conducted 5 d per week, followed by a 2 d break. On training days, the bats received food only as a reward (consisting of banana pulp) in the training setup. On the days without training they had access to mealworms (larvae of Tenebrio molitor) ad libitum.
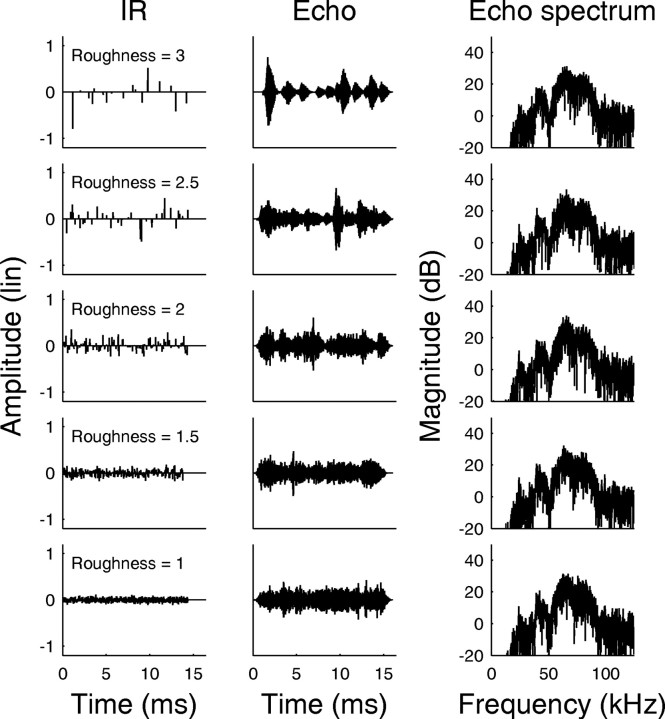
Impulse responses. We created complex IRs with different degrees of roughness, similar to a previous experiment (Grunwald et al., 2004). Each IR consisted of sparse noise, which is generated by inserting random-width temporal gaps between the amplitude values of Gaussian noise (Hübner and Wiegrebe, 2003). All IRs generated this way had chaotic waveforms (see Fig. 3, first column) and frequency-independent (white) magnitude spectra (data not shown). Thus, the magnitude spectra do not vary systematically with IR roughness. When such an IR is convolved with an echolocation call, the resulting echo has the magnitude spectrum of the echolocation call (see Fig. 3, third column) because a convolution in the time domain corresponds to a multiplication in the frequency domain.
Figure 3.
Examples from the stimulus set for the psychophysical and neurophysiological experiments in P. discolor. The first column shows the IRs used to generate the echoes in the psychophysical playback experiment. The roughness of the IRs, quantified as the base 10 logarithm of the wave form fourth moment is shown in each panel. The second column shows echoes generated from the IRs in the first column with a standard P. discolor echolocation call. These echoes were used as stimuli for the neurophysiological experiments. The magnitude spectra of the echoes are shown in the third column. Note that the magnitude spectra and the overall sound-pressure level are independent of roughness.
IR roughness was quantified in terms of the fourth moment (M4; the IR wave form raised to the power of four divided by the squared wave form raised to the power of two) (Hartmann and Pumplin, 1988). Roughness values are given as the base 10 logarithm of the M4 (log10M4). The IRs were sorted into 31 groups ranging from a roughness of 0.5 to 3.5 log10M4. Each group contained 25 different IRs of the same roughness, giving a total of 775 IRs, thereby ensuring that each IR was rarely presented twice. All IRs had the same root-mean-square amplitude. At a sampling rate of 250 kHz, the IRs had a duration of 14.4 ms, equivalent to an object depth of ∼2.5 m.
Experimental setup. The bats were trained in a two-alternative, forced-choice playback setup. It consisted of a Y-shaped maze, inversely mounted on the wall of an echo-attenuated chamber at an angle of 45 degrees. The starting perch was located at the top end. In each branch, a reward feeder, a 0.25 inch microphone (model 4135; B&K Instruments, Naerum, Denmark), and a speaker (model EAS10 TH800D; Matsushita, Osaka, Japan) were mounted facing toward the starting perch. During the experiment, the emitted echolocation calls were recorded by both microphones. Each microphone output was amplified (model 2610; B&K Instruments), bandpass filtered (30–100 kHz; model 3550; Krohn Hite, Brockton, MA), and digitized by a data-acquisition board [data acquisition processor (DAP) 5200a; Microstar, Bellevue, WA] at a sampling rate of 250 kHz. The boards convolved the input with two different IRs (a smooth IR on one side and a rougher IR on the other) on the DAP-boards by zero-padding both the recorded call and the IRs to 4096 samples, and multiplying the complex spectra of the recorded call and IR. This procedure corresponds to the formation of an echo of a phantom object, that is to say, every change in the bat's echolocation call results in an immediate change in the artificial echo. The artificial echo was amplified (model 6110; Harman/Kardon, Chāteau du Loir, France) and played back to the bat after a total delay of 18 ms, corresponding to a target distance of ∼3m.
Procedure. All four bats were trained to discriminate IR roughness in a two-alternative, forced-choice paradigm. To obtain a food reward the bats had to crawl toward the end of that branch of the Y maze where the echo generated with the IR of reference roughness originated. The test IR roughness was always higher than the reference roughness. When the bats' performance exceeded 85% correct in this discrimination task, psychometric functions were obtained. Whereas the reference roughness was kept constant, the test roughness was changed randomly. The stochastic IRs were refreshed for every presentation. Each point of the psychometric function is based on 30 trials. The discrimination threshold was set to 75% correct, which, on the basis of 30 trials, corresponds to a significance level of p < 0.05. The experiment was repeated four times with four different reference roughnesses, namely 0.5, 1.8, 2.5, and 2.8 log10M4.
Neurophysiology
Surgery. All experiments complied with the principles of laboratory animal care and were conducted under the regulations of the current version of the German Law on Animal Protection (approval 209.1/211-2531-68/03, Reg. Oberbayern). The principle surgical procedure has been described in detail previously (Schuller et al., 1991). In brief, bats were anesthetized using a combination of medetomidin, midazolam, and fentanyl (0.4, 4, and 0.04 μg/g body weight, respectively). The skin overlying the skull was opened along the midline and the skull surface was freed from tissue. A small metal tube was fixed to the skull using a microglass composite to secure the animal to a stereotaxic device, and the accurate skull position in stereotaxic coordinates was determined as described in detail previously (Schuller et al., 1986).
Stimulus production and recording of neural responses. Experiments were conducted in an anechoic chamber. Acoustic stimuli were computer generated (Matlab; Mathworks, Natick, MA), digital-analog converted (RV8; sampling rate, 400 kHz; Tucker Davis Technologies, Gainesville, Fl), filtered and attenuated (TDT FT-6; TDT PA5; Tucker Davis Technologies), and binaurally presented via custom-made ultrasonic earphones with a flat frequency response (±3 dB) between 10 and 100 kHz (Schuller, 1997). Stimuli consisted of a typical echolocation call of P. discolor (frequency range, 40–90 kHz) convolved with a stochastic IR. After the convolution, the stimuli had a duration of 18 ms. Fifty IRs in five groups of roughness were used (1.8, 2.0, 2.3, 2.5, and 2.8 log10M4) (i.e., in the range of the behavioral experiments). Stimuli were randomly presented at 20–30 dB above the pure-tone threshold of a neuron, with 10–20 repetitions of the entire set and a silent interval of 10 ms before stimulus onset. The repetition rate was 1.3 Hz.
Action potentials from neurons in the auditory cortex of three lightly anesthetized bats were recorded extracellularly using glass microelectrodes filled with 2 m NaCl and 4% pontamine sky blue (3–8 MΩ impedance). Because it was not always possible to clearly discriminate the activity of a single neuron, the term “unit” will be used in the following to describe the collective activity of one to three neurons recorded at a recording site. Neural activity was monitored audiovisually, and threshold and best frequency of a unit were roughly determined. Action potentials were amplified using conventional methods and recorded using an analog-to-digital converter (RP2.1; Tucker Davis Technologies; sampling rate, 25 kHz) and Brainware (Tucker Davis Technologies). Electrode penetrations were tangential to the brain surface. After the completion of an experiment, lesions were made to the brain to reconstruct the position of recording sites from subsequent histological processing in standardized coordinates of a brain atlas of P. discolor (A. Nixdorf, T. Fenzl, B. Schwellnus, unpublished data).
Data analysis. Spike responses from all 50 stimuli were displayed as peristimulus time histograms (PSTH; 1 ms bin width) and raster plots. Units typically responded with an onset response followed by a clearly distinguishable sustained response component. As will be seen below, the onset response occurred with each of the 50 stimuli independent of roughness. Therefore, it was excluded from additional analysis by setting a time window containing only the sustained response. Size and position of the window were derived from the PSTH. The analysis window started immediately after the end of the onset response and ended when the sustained response level reached the level of spontaneous activity. Spontaneous activity was derived from the 10 ms time window preceding stimulus onset. Responses to stimuli from each of the five roughness groups were tested for statistically significant differences using a Kruskal–Wallis Test with a correction for multiple testing (Matlab statistics toolbox; Mathworks). Significance was set at p < 0.05.
Results
Psychophysics
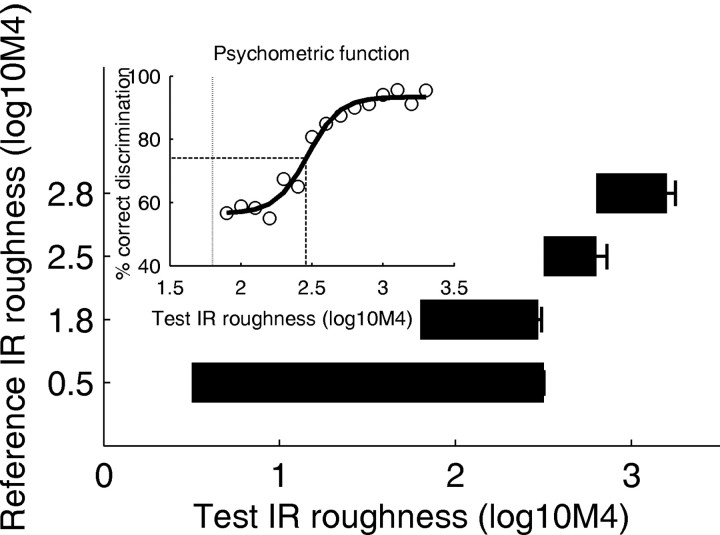
A psychometric function for IR roughness discrimination with a reference roughness of 1.8 (in units of log10M4) is shown in the inset of Figure 1. Data are averaged across the four animals. The function shows that for a reference roughness of 1.8, the bats need a test roughness of at least 2.5 to reliably discriminate IR roughness.
Figure 1.
Results of the psychophysical experiments. The inset shows a psychometric function for IR-roughness discrimination (open circles). The reference IR roughness was 1.8 (vertical dotted line). The discrimination threshold was determined by fitting a sigmoid function (strong solid line) and extracting the 75% correct value (dashed lines). The horizontal bars show the average results for the four values of reference roughness. The left end of each bar shows the reference roughness, and the right end shows the discrimination threshold. Error bars represent across-animal SE.
The four horizontal bars present the summary results for the four values of reference roughness. Each bar shows the minimal roughness difference needed to significantly discriminate IRs with the test roughness from IRs with the reference roughness. These results show that there is a fixed behavioral threshold for IR roughness discrimination; a roughness of ∼2.5 is required by the bats to reliably discriminate an IR with this roughness from a smoother one. Above this threshold, discrimination performance improves substantially.
Neurophysiology
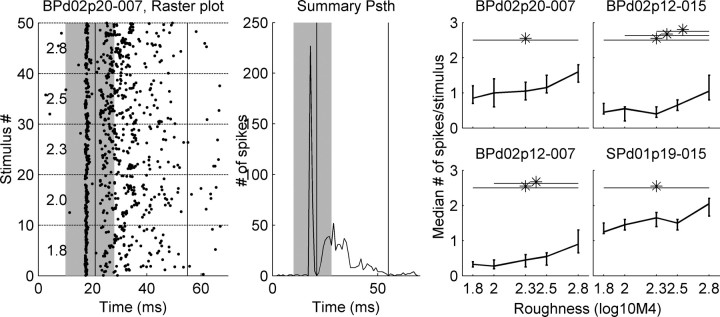
Results are based on 94 cortical units. All units responded well to frequencies in the range of the echolocation calls of P. discolor (40–90 kHz). A total of 15 of 94 units responded with significant difference to stimuli with different degrees of roughness (p < 0.05; Kruskal-Wallis nonparametric one-way ANOVA). The raster plot and the summary PSTH in Figure 2 reveal a strong onset response followed by a variable degree of sustained activity. For the response-strength analysis, only the sustained activity was used. The analysis window was terminated when the level of spontaneous activity was reached. The range of analysis-window durations of all roughness-sensitive units was from 19 to 126 ms (median, 34 ms). The stimulus duration was 18 ms. Thus, the analysis window was often considerably longer than the stimulus duration.
Figure 2.
Electrophysiological results. The left plot shows a raster plot of a roughness-sensitive unit to 10 repetitions of all 50 stimuli; the middle plot shows the PSTH summed over all stimuli and repetitions. The summary PSTH was used to exclude the onset responses from additional analysis by setting a time window (vertical solid lines in the PSTH and raster plot), which started immediately after the end of the onset response and ended when the sustained response level reached the level of spontaneous activity. The time of stimulus presentation is indicated by the gray area in the PSTH and raster plot. Response strength as a function of IR roughness is shown for four roughness-sensitive units in the auditory cortex of P. discolor in the four panels on the right. Response strength is shown as the median number of spikes per stimulus across 10 different echoes sharing the IR roughness given on the abscissa. Vertical bars represent the range of the 25 and 75% percentile. Significant response differences (Kruskal–Wallis test, p < 0.05) are indicated by the horizontal lines and asterisks.
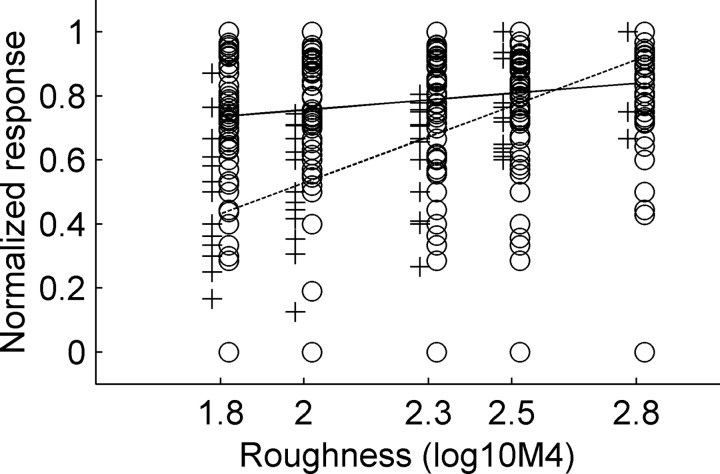
Examples of responses of four units whose firing increased significantly with increasing stimulus roughness are shown in the right panels of Figure 2. Note that the stimuli with different roughnesses share the same sound-pressure level and the same power spectrum (compare Fig. 3). Except for one unit, all units with significant roughness coding responded stronger to stimuli with higher roughness. This is shown in a summary plot of all units in Figure 4. The regression line for roughness-sensitive units has a significantly steeper slope compared with the regression line for nonsensitive units [ANCOVA linear regression; Matlab signal processing toolbox (Mathworks); p < 0.001].
Figure 4.
Comparison of the regression lines of response strength calculated for all 14 roughness-sensitive units for which responses increased with increasing roughness (dashed line) and all nonsensitive units (solid line). IR roughness is shown on the abscissa, and normalized response strength is shown on the ordinate. The crosses show normalized response strength for roughness-sensitive units, and the circles show response strength for nonsensitive units. The slope of the regression line is significantly steeper for the roughness-sensitive units, indicating that the response of sensitive units increases with IR roughness (p < 0.001; AN-COVA). The slope of the regression line of the roughness-insensitive units is very shallow, showing that, for these units, the response strength is not correlated with IR roughness.
The relative strengths of onset and sustained responses do not correlate to the ability of the units to encode echo roughness. In 70 of the 94 units, the onset-response magnitude was weaker than the sustained response; in 24 units the opposite was true. Of the 14 roughness-sensitive units in which responses increased significantly with increasing roughness, eight had a stronger onset response than sustained response, and the other six had a stronger sustained response.
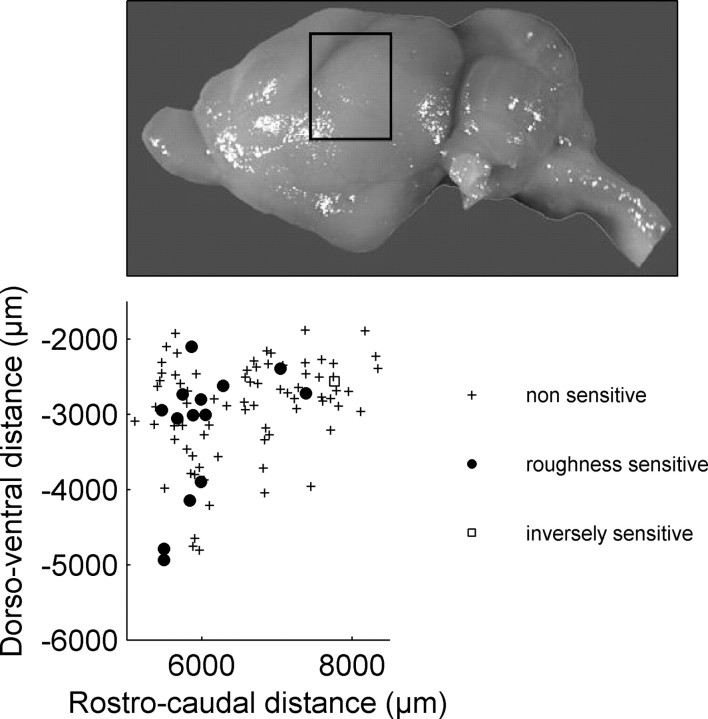
The recordings were derived from locations covering a distance of ∼3500 μm along the rostrocaudal axis and ∼3000 μm along the dorsoventral axis (compare Fig. 5), which corresponds to the neuroanatomically evaluated dimension of the auditory cortex of P. discolor (S. Radtke-Schuller, personal communication). Units with significant responses to roughness were not uniformly distributed on the auditory cortical surface but were almost exclusively located in anterior regions of auditory cortex (Fig. 5). The only unit that responded more strongly to smooth stimuli was located in the posterior part of the auditory cortex.
Figure 5.
Location of recording sites in the auditory cortex of P. discolor. The limits of the scatter plot are superimposed on a photograph of the P. discolor brain. Units that were not significantly sensitive to IR roughness are shown as crosses, and roughness-sensitive units are shown as filled circles. The one open square represents a single unit that showed inverse roughness sensitivity (i.e., the rate response decreased with increasing IR roughness).
The clustering of sensitive units in the anterior parts of the auditory cortex also means that the relative percentage of sensitive units is underestimated when calculated for the total cortical area scanned in our experiments. The relative density of roughness-sensitive units would increase if only calculated for the anterior parts; however, because we do not yet have the accurate anatomical limits of different cortical fields, such an analysis was not possible.
Comparison of psychophysics and neurophysiology
To compare the psychophysical discrimination performance and the roughness sensitivity of cortical units, a receiver operating characteristics (ROC) analysis was used (Green and Swets, 1966; Britten et al., 1992) to generate a neurometric function along the same axes as the psychometric function. The neurometric function reflects the probability that an ideal observer could accurately discriminate IR roughness basing his judgments on responses like those recorded from the units under study.
The ROC analysis was performed by generating a so-called ROC curve for the comparison of each signal condition (roughness >1.8) and the standard condition (roughness, 1.8). The ROC curve shows the probability that both the rate response in a signal condition and the response in the standard condition exceed a certain threshold (e.g., one spike per stimulus). This probability was plotted as a function of the height of the threshold. From there, the (neural) percentage of correct discrimination for each signal condition was generated by calculating the area under the ROC curve.
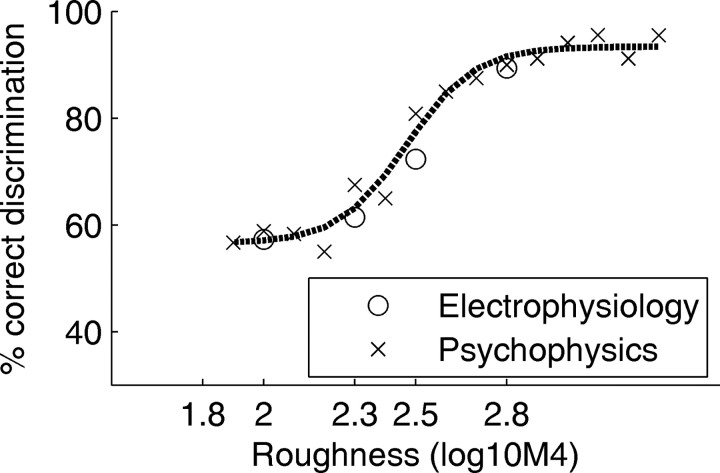
For the current comparison, we pooled the responses of all 14 units whose response increased significantly with IR roughness. The resulting neurometric function is shown together with a replot of the psychometric function with a reference roughness of 1.8 in Figure 6. The analysis shows that there is a good agreement between the psychophysical performance and the ideal-observer performance based on the subgroup of roughness-sensitive units.
Figure 6.
Comparison of the psychophysical and neurophysiological roughness-discrimination performance. The crosses show the psychophysical performance with a reference roughness of 1.8; the dotted line is a sigmoidal fit to the psychophysical data. The open circles show the performance of an ideal observer (using a receiver-operating-characteristics analysis) basing its decisions on the pooled responses of the 14 roughness-sensitive cortical units found in this study.
Note that the psychometric function for a reference roughness of 0.5 was very similar to that for a reference of 1.8, indicating that the animals could not discriminate roughness <1.8. The neurophysiological data set was therefore limited to the roughness region between 1.8 and 2.8.
Discussion
In the present study, neurons were found in anterior regions of the auditory cortex of the bat P. discolor that encoded echo roughness in their response strength. The performance of these neurons closely matched the bats' behavioral sensitivity to echo roughness as a physiological correlate to statistical echo analysis in the auditory cortex.
Because the exact partitioning of the auditory cortex and the location of different cortical fields is not yet known for P. discolor, the location of roughness-sensitive units in the auditory cortex cannot be precisely attributed to defined cortical areas. However, Esser and Eiermann (1999) have investigated the organization of the auditory cortex in a closely related phyllostomid bat species Carollia perspicillata. They described six different auditory fields including the primary auditory cortex (AI), a rostrally adjoining anterior auditory field (AAF), and two dorsally located auditory fields. It can be assumed that the general organization of the auditory cortex is not very different in P. discolor. Roughness-sensitive units were found mainly in anterior regions over the whole dorsoventral distance. Thus, roughness-sensitive units seem to be mainly located in two cortical fields, probably representing the AAF and an anterior dorsal field. Only a few recordings were derived from units in posterior ventral regions where the AI might be located, so no clear assertion about encoding of echo roughness can be made for neurons in the AI.
Complex response patterns consisting of a phasic onset response followed by a sustained excitatory response have been described for neurons in the inferior colliculus (IC) and the auditory cortex of various mammals (Geisler et al., 1969; Heil, 1998; Brosch and Scheich, 2003). Several studies showed that different stimulus features can be differentially encoded by onset and sustained-response components. Heil (1998) showed that binaural envelope transients are encoded by the onset response of neurons in the inferior colliculus of rats, whereas the binaural combination of steady state intensities is encoded by the sustained response. For the auditory cortex, it was also shown that the onset-response strength is related to the rising-envelope slope rather than to the steady-state intensities (Heil, 1997; Heil and Irvine, 1998). Ahissar et al. (1992) showed that the majority of motion-sensitive neurons in the auditory cortex of awake monkeys showed motion sensitivity in their sustained components. These findings support our results: whereas the stimulus onset evoked a strong onset response independent of roughness, the sustained response was highly dependent on stimulus roughness.
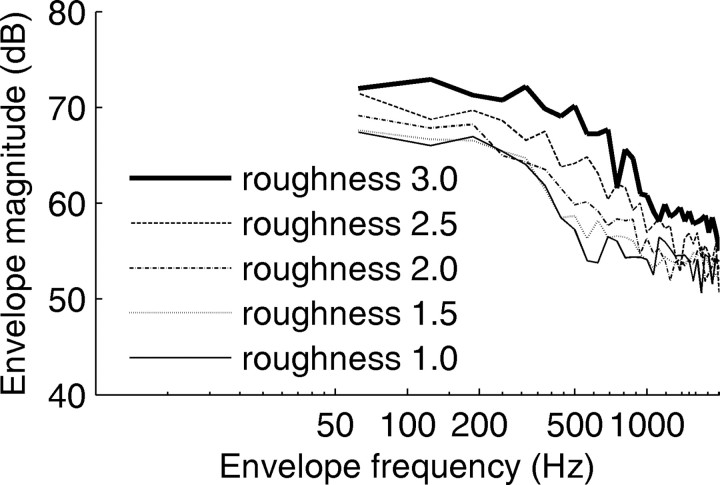
Grunwald et al. (2004) argued that modulation-sensitive units possibly located in the inferior colliculus may play a role in the processing of echo roughness. Physiological modulation sensitivity has mainly been tested with sinusoidally amplitude-modulated (SAM) stimuli. The envelope spectra of these stimuli (the magnitude spectra of their Hilbert envelopes) are narrow band and they show a pronounced peak at the modulation frequency. The envelope spectra of the stimuli used in this study differ substantially. Because of the aperiodic and transient nature of the IRs, the envelope spectra of the echoes are broad band and with increasing roughness, the envelope magnitude increases for all modulation frequencies. The systematic effect of echo roughness on the envelope spectra is shown in Figure 7. The roughness-dependent changes are most prominent in the envelope-frequency region ∼500 Hz.
Figure 7.
Envelope magnitude spectra of echo stimuli presented in the neurophysiological experiments. Unlike the magnitude spectra of the wave form (compare Fig. 1, right column), the envelope spectra vary systematically with roughness. With increasing roughness, the envelope magnitude increases for all envelope frequencies; however, the increase is most pronounced in the envelope-frequency range, ∼500 Hz.
The IR roughness sensitivity investigated in this study is, thus, most closely related to modulation-depth sensitivity rather than to modulation-frequency sensitivity, per se.
Human psychophysical sensitivity to the modulation depth of SAM noise has been measured first by Wakefield and Viemeister (1990). Later studies (Ewert and Dau, 2004) confirmed for a broad stimulus set that, above the SAM detection threshold, modulation-depth discrimination is constant at ∼1 dB. Although there are no data on modulation-depth discrimination in bats, the envelope spectra of the current stimuli (Fig. 7) indicate changes in the envelope spectra clearly exceeding the human 1 dB threshold.
Krishna and Semple (2000) investigated responses of inferior-colliculus neurons in the Mongolian gerbil to SAM tones varying in both modulation frequency and modulation depth. They showed that the rate modulation transfer function depended significantly on modulation depth. Dependent on modulation frequency, changes in modulation depth could result in either suppression or enhancement of the rate responses. Thus, Krishna and Semple (2000) demonstrated that at the level of the inferior colliculus, some units can encode modulation depth. However, as outlined above, the envelope spectra differ substantially from those of our stimuli.
Stimuli that are more similar to ours have been used by Kvale and Schreiner (2004) in the inferior colliculus of cats. They used pure-tone carriers modulated with an 800 Hz rectangular modulator and stochastic modulation-depth variations. Like our current stimuli, these stimuli have a broad-band envelope spectrum. Also similar to a roughness increase in our current stimuli, an increase in the variance of modulation depth results in an increase of the envelope magnitude for this broad range of envelope frequencies. Kvale and Schreiner showed that neurons in the inferior colliculus can detect dynamic changes in variance of their modulation depth distribution in their firing rate. These studies suggest that roughness-related response changes may exist at the level of the inferior colliculus in the bat P. discolor.
To our knowledge, modulation-depth coding has not been studied at the level of the auditory cortex. Figure 7 shows that sensitivity to relatively high-modulation frequencies ∼500 Hz is a prerequisite for the encoding of IR roughness. Therefore, tuning to modulation frequency cannot be ignored in this context. Schreiner and Urbas (1988) found that neurons in the AAF of cats had highest best modulation frequencies for both phase-locked and rate responses, whereas best modulation frequencies in AI and the posterior auditory field were markedly lower. Thus, the localization of roughness-sensitive units in anterior parts of the auditory cortex of P. discolor resembles the representation of high-frequency amplitude modulations in the auditory cortex of the cat.
Phase locking in auditory-cortex neurons to SAM is limited to low-modulation frequencies (Langner, 1992). Previous reports suggest that various cellular and network properties such as adaptation and synaptic depression may underlie this low-pass response behavior (Joris et al., 2004; Wehr and Zador, 2005). However, Lu et al. (2001) showed that a distinct population of neurons exists in the auditory cortex of marmosets that encodes high-modulation frequencies as a rate code. A rate code for high-modulation frequencies in the auditory cortex was also reported in other studies (Bieser and Muller-Preuss, 1996; Liang et al., 2002; Lu and Wang, 2004). Our current results suggest that neurons in the auditory cortex of P. discolor represent IR roughness as a rate code.
In addition to intracortical mechanisms underlying the generation of a rate code for high-modulation frequencies, a transformation of the temporal code into a rate code at the level of the IC is also discussed (Langner, 1992). Hewitt and Meddis (1994) simulated the transformation of a temporal code for amplitude modulation in cochlear-nucleus sustained-chopper cells into a rate code of amplitude modulation through inferior-colliculus coincidence-detector cells. Ongoing experiments in our lab try to localize the neural substrate for the transformation of roughness into a rate code.
Although the auditory cortex may simply reflect properties of periodicity coding generated in the midbrain, the auditory cortex is crucial for relating an auditory representation to behavior (Heffner and Heffner, 1990; Riquimaroux et al., 1991; Smith et al., 2004). It has been suggested that the role of the auditory cortex might be to organize sound features already extracted by lower levels into auditory objects (Nelken, 2004). Previous work indicates that for P. discolor, the IR roughness contributes to auditory object formation (Grunwald et al., 2004). Thus, the neural correlate of psychophysical performance for auditory object identification is most likely to be found in the auditory cortex.
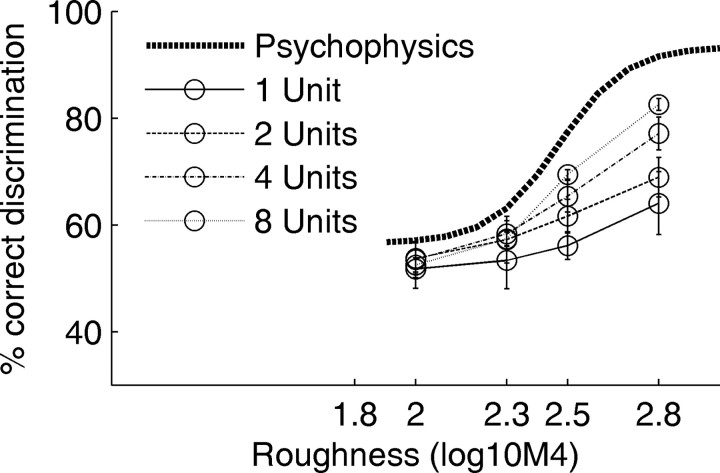
The current comparison of the psychophysical and neuronal performance was based on the pooled responses of all 14 roughness-sensitive units. The response of no single unit on its own matched the psychophysical performance. To investigate the least number of units required to match the psychophysical performance, we repeated the ROC analysis for subsets of the roughness-sensitive units. The ideal-observer results are shown together with the psychophysical performance in Figure 8. With a lower number of units included for the ROC analysis, the ideal-observer performance drops remarkably. Note that the repeated random drawings of a subset of the 14 roughness-sensitive units resulted in quite stable predictions of ideal-observer performance. This finding confirms that this small population of 14 units is in itself homogeneous.
Figure 8.
Ideal-observer performance for roughness discrimination as a function of the number of pooled unit responses. The strong dotted line shows the psychophysical performance replotted from Figure 6. The ideal-observer responses were obtained by 10 random draws of the specified numbers of units from the set of the 14 roughness-sensitive units. The error bars show SE across these 10 draws. With increasing number of pooled unit responses, the performance improves.
It is highly likely that there are many more roughness-sensitive units in the auditory cortex of P. discolor. Thus, it must be assumed that the animal's ability to combine the neural information across units is suboptimal.
Although the current data show a high correlation between the psychophysical performance and the performance of a subpopulation of cortical neurons, this correlation does not prove a causal connection between the two. To this end, additional experiments should be performed in which the regions containing this subpopulation of roughness-sensitive neurons should be reversibly inactivated while the animals perform the psychophysical task. Nevertheless, the current results show that psychophysical sensitivity to IR roughness as an ecologically meaningful parameter is quantitatively encoded in the auditory cortex of the echolocating bat P. discolor.
Footnotes
This work was supported by the Deutsche Forschungsgemeinschaft Grants WI 1518/6 (L.W.) and SCH 390/6 (G.S.), and by the VW-Stiftung (I/79782). We thank Benedikt Grothe, George Pollak, Gerhard Neuweiler, Michael Burger, and two reviewers for helpful and constructive comments on previous versions of this paper. Many thanks also to Susanne Radtke-Schuller for her help with the reconstruction of recording sites. We also thank Claudia Schulte and Britta Schwellnus for their help.
Correspondence should be addressed to Lutz Wiegrebe, Department Biologie II der Ludwig-Maximilians-Universität München, Großhaderner Strasse 2, D-82152 Planegg-Martinsried, Germany. E-mail: lutzw@lmu.de.
DOI:10.1523/JNEUROSCI.3478-05.2006
Copyright © 2006 Society for Neuroscience 0270-6474/06/260785-07$15.00/0
U.F. and S.S. contributed equally to this work
References
- Ahissar M, Ahissar E, Bergman H, Vaadia E (1992) Encoding of sound-source location and movement: activity of single neurons and interactions between adjacent neurons in the monkey auditory cortex. J Neurophysiol 67: 203–215. [DOI] [PubMed] [Google Scholar]
- Bieser A, Muller-Preuss P (1996) Auditory responsive cortex in the squirrel monkey: neural responses to amplitude-modulated sounds. Exp Brain Res 108: 273–284. [DOI] [PubMed] [Google Scholar]
- Britten KH, Shadlen MN, Newsome WT, Movshon JA (1992) The analysis of visual motion: a comparison of neuronal and psychophysical performance. J Neurosci 12: 4745–4765. [DOI] [PMC free article] [PubMed] [Google Scholar]
- Brosch M, Scheich H (2003) Neural representation of sound patterns in the auditory cortex of monkeys. In: Primate audition: ethology and neurobiology (Ghazanfar AA, ed), pp 151–175. Boca Raton, FL: CRC.
- Esser KH, Eiermann A (1999) Tonotopic organization and parcellation of auditory cortex in the FM-bat Carollia perspicillata Eur J Neurosci 11: 3669–3682. [DOI] [PubMed] [Google Scholar]
- Ewert SD, Dau T (2004) External and internal limitations in amplitude-modulation processing. J Acoust Soc Am 116: 478–490. [DOI] [PubMed] [Google Scholar]
- Geisler CD, Rhode WS, Hazelton DW (1969) Responses of inferior colliculus neurons in the cat to binaural acoustic stimuli having wide-band spectra. J Neurophysiol 32: 960–974. [DOI] [PubMed] [Google Scholar]
- Green DM, Swets JA (1966) Signal detection theory and psychophysics. New York: Wiley.
- Grunwald JE, Schornich S, Wiegrebe L (2004) Classification of natural textures in echolocation. Proc Natl Acad Sci USA 101: 5670–5674. [DOI] [PMC free article] [PubMed] [Google Scholar]
- Hartmann WM, Pumplin J (1988) Noise power fluctuations and the masking of sine signals. J Acoust Soc Am 83: 2277–2289. [DOI] [PubMed] [Google Scholar]
- Heffner HE, Heffner RS (1990) Effect of bilateral auditory cortex lesions on sound localization in Japanese macaques. J Neurophysiol 64: 915–931. [DOI] [PubMed] [Google Scholar]
- Heil P (1997) Auditory cortical onset responses revisited. II. Response strength. J Neurophysiol 77: 2642–2660. [DOI] [PubMed] [Google Scholar]
- Heil P (1998) Neuronal coding of interaural transient envelope disparities. Eur J Neurosci 10: 2831–2847. [DOI] [PubMed] [Google Scholar]
- Heil P, Irvine DR (1998) The posterior field P of cat auditory cortex: coding of envelope transients. Cereb Cortex 8: 125–141. [DOI] [PubMed] [Google Scholar]
- Hewitt MJ, Meddis R (1994) A computer model of amplitude-modulation sensitivity of single units in the inferior colliculus. J Acoust Soc Am 95: 2145–2159. [DOI] [PubMed] [Google Scholar]
- Hübner M, Wiegrebe L (2003) The effect of temporal structure on rustling-sound detection in the gleaning bat, Megaderma lyra J Comp Physiol A Neuroethol Sens Neural Behav Physiol 189: 337–346. [DOI] [PubMed] [Google Scholar]
- Joris PX, Schreiner CE, Rees A (2004) Neural processing of amplitude-modulated sounds. Physiol Rev 84: 541–577. [DOI] [PubMed] [Google Scholar]
- Krishna BS, Semple MN (2000) Auditory temporal processing: responses to sinusoidally amplitude-modulated tones in the inferior colliculus. J Neurophysiol 84: 255–273. [DOI] [PubMed] [Google Scholar]
- Kvale MN, Schreiner CE (2004) Short-term adaptation of auditory receptive fields to dynamic stimuli. J Neurophysiol 91: 604–612. [DOI] [PubMed] [Google Scholar]
- Langner G (1992) Periodicity coding in the auditory system. Hear Res 60: 115–142. [DOI] [PubMed] [Google Scholar]
- Liang L, Lu T, Wang X (2002) Neural representations of sinusoidal amplitude and frequency modulations in the primary auditory cortex of awake primates. J Neurophysiol 87: 2237–2261. [DOI] [PubMed] [Google Scholar]
- Lu T, Wang X (2004) Information content of auditory cortical responses to time-varying acoustic stimuli. J Neurophysiol 91: 301–313. [DOI] [PubMed] [Google Scholar]
- Lu T, Liang L, Wang X (2001) Temporal and rate representations of time-varying signals in the auditory cortex of awake primates. Nat Neurosci 4: 1131–1138. [DOI] [PubMed] [Google Scholar]
- Muller R, Kuc R (2000) Foliage echoes: a probe into the ecological acoustics of bat echolocation. J Acoust Soc Am 108: 836–845. [DOI] [PubMed] [Google Scholar]
- Nelken I (2004) Processing of complex stimuli and natural scenes in the auditory cortex. Curr Opin Neurobiol 14: 474–480. [DOI] [PubMed] [Google Scholar]
- Riquimaroux H, Gaioni SJ, Suga N (1991) Cortical computational maps control auditory perception. Science 251: 565–568. [DOI] [PubMed] [Google Scholar]
- Riquimaroux H, Gaioni SJ, Suga N (1992) Inactivation of the DSCF area of the auditory cortex with muscimol disrupts frequency discrimination in the mustached bat. J Neurophysiol 68: 1613–1623. [DOI] [PubMed] [Google Scholar]
- Schreiner CE, Urbas JV (1988) Representation of amplitude modulation in the auditory cortex of the cat. II. Comparison between cortical fields. Hear Res 32: 49–63. [DOI] [PubMed] [Google Scholar]
- Schuller G (1997) A cheap earphone for small animals with good frequency response in the ultrasonic frequency range. J Neurosci Methods 71: 187–190. [DOI] [PubMed] [Google Scholar]
- Schuller G, Radtke-Schuller S, Betz M (1986) A stereotaxic method for small animals using experimentally determined reference profiles. J Neurosci Methods 18: 339–350. [DOI] [PubMed] [Google Scholar]
- Schuller G, O'Neill WE, Radtke-Schuller S (1991) Fascilitation and delay sensitivity of auditory cortex neurons in CF-FM bats Rhinolophus rouxi and Pteronotus p.parnellii Eur J Neurosci 3: 1165–1181. [DOI] [PubMed] [Google Scholar]
- Smith AL, Parsons CH, Lanyon RG, Bizley JK, Akerman CJ, Baker GE, Dempster AC, Thompson ID, King AJ (2004) An investigation of the role of auditory cortex in sound localization using muscimol-releasing Elvax. Eur J Neurosci 19: 3059–3072. [DOI] [PubMed] [Google Scholar]
- Stilz WP (2004) Akustische untersuchungen zur echoortung bei fledermäusen. PhD thesis, University of Tuebingen.
- Wakefield GH, Viemeister NF (1990) Discrimination of modulation depth of sinusoidal amplitude modulation (SAM) noise. J Acoust Soc Am 88: 1367–1373. [DOI] [PubMed] [Google Scholar]
- Wehr M, Zador AM (2005) Synaptic mechanisms of forward suppression in rat auditory cortex. Neuron 47: 437–445. [DOI] [PubMed] [Google Scholar]


