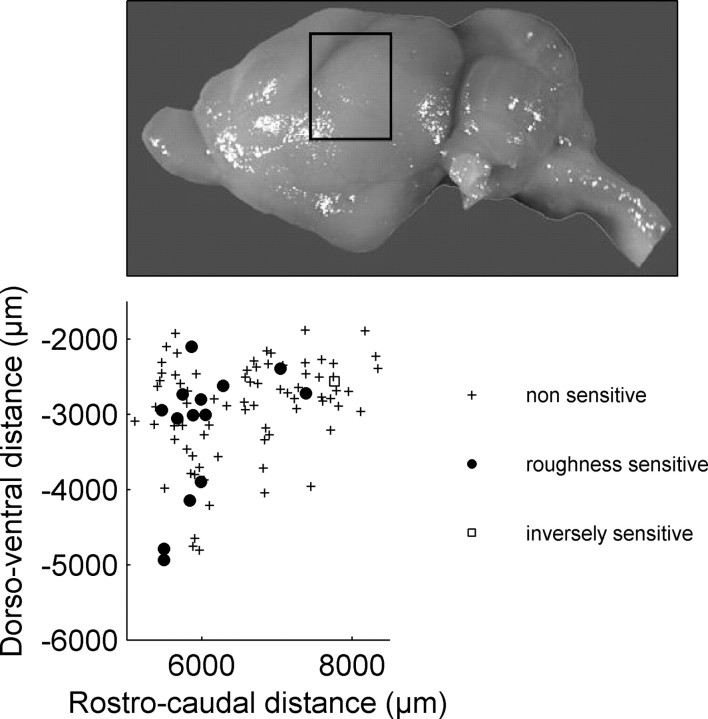
Figure 5.
Location of recording sites in the auditory cortex of P. discolor. The limits of the scatter plot are superimposed on a photograph of the P. discolor brain. Units that were not significantly sensitive to IR roughness are shown as crosses, and roughness-sensitive units are shown as filled circles. The one open square represents a single unit that showed inverse roughness sensitivity (i.e., the rate response decreased with increasing IR roughness).

