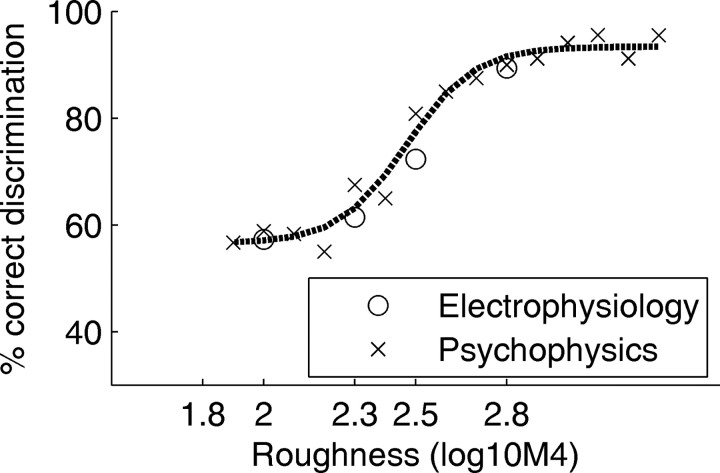
Figure 6.
Comparison of the psychophysical and neurophysiological roughness-discrimination performance. The crosses show the psychophysical performance with a reference roughness of 1.8; the dotted line is a sigmoidal fit to the psychophysical data. The open circles show the performance of an ideal observer (using a receiver-operating-characteristics analysis) basing its decisions on the pooled responses of the 14 roughness-sensitive cortical units found in this study.

