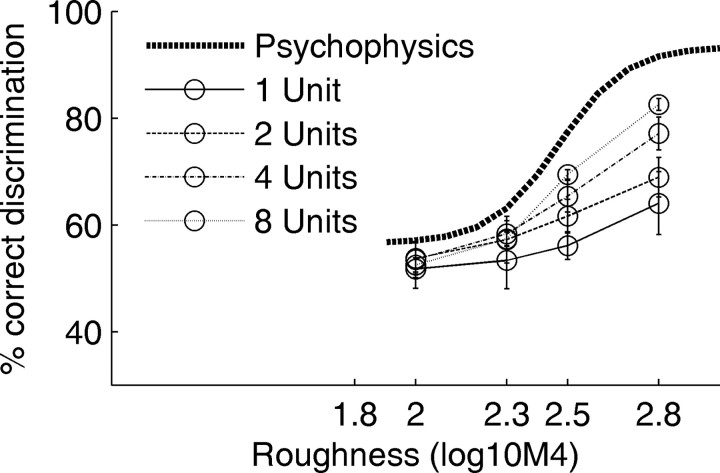
Figure 8.
Ideal-observer performance for roughness discrimination as a function of the number of pooled unit responses. The strong dotted line shows the psychophysical performance replotted from Figure 6. The ideal-observer responses were obtained by 10 random draws of the specified numbers of units from the set of the 14 roughness-sensitive units. The error bars show SE across these 10 draws. With increasing number of pooled unit responses, the performance improves.

