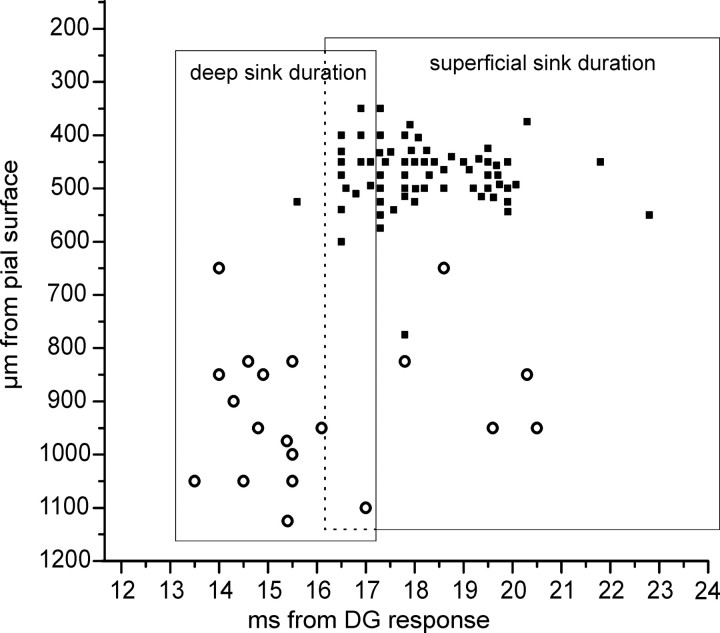
Figure 6.
Correlation between the sinks recorded with 16-channel silicon probes and the onset of superficial cell IPSPs (filled squares) and deep cell EPSPs (open circles). The position of the symbols on the y axis represents the depth of the neuron from which the synaptic potential was recorded. The time extensions of the deep and superficial sinks located at 800–1000 μm and at 500–800 μm, respectively, are shown by the rectangular areas. The average duration of each sink was calculated on 14 experiments. Note the area of overlap between the two sinks.

