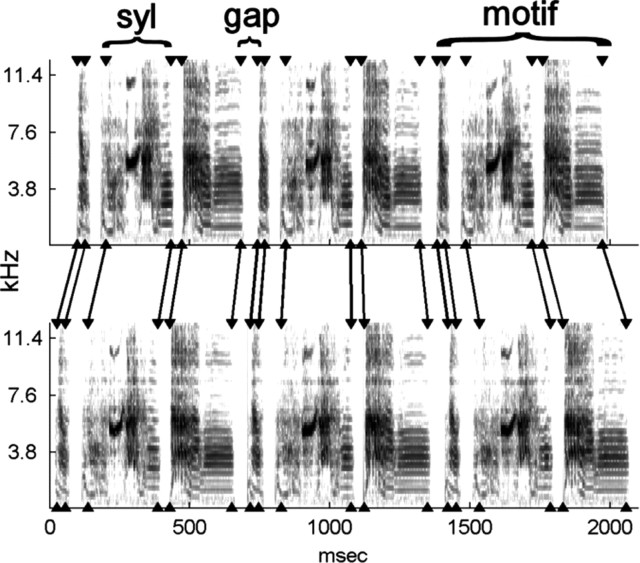
Figure 2.
Zebra finch song. Spectrograms from the shortest (top) and longest (bottom) songs in the sequences recorded from bird 10. Arrowheads indicate the onset and offset of each syllable measured by an automated algorithm. The algorithm marks syllable boundaries according to reliable peaks in the amplitude derivative, so that less reliable, small amplitude parts of some syllables fall outside these boundaries (see Materials and Methods).

