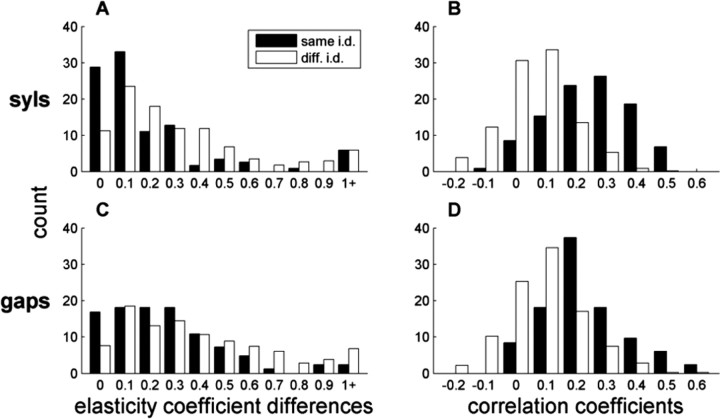
Figure 9.
Intervals of the same identity are linked. Distributions of pairwise differences between elasticity coefficients (A, C) and pairwise Pearson's coefficients (B, D) for syllables (A, B) and gaps (C, D). Black, Pairs containing intervals of the same identity (i.d.) (e.g., syllable D in motifs 1 and 3, gap between B and C in motifs 2 and 3). White, Pairs containing intervals of the same type (syl–syl or gap–gap) but different identity.

