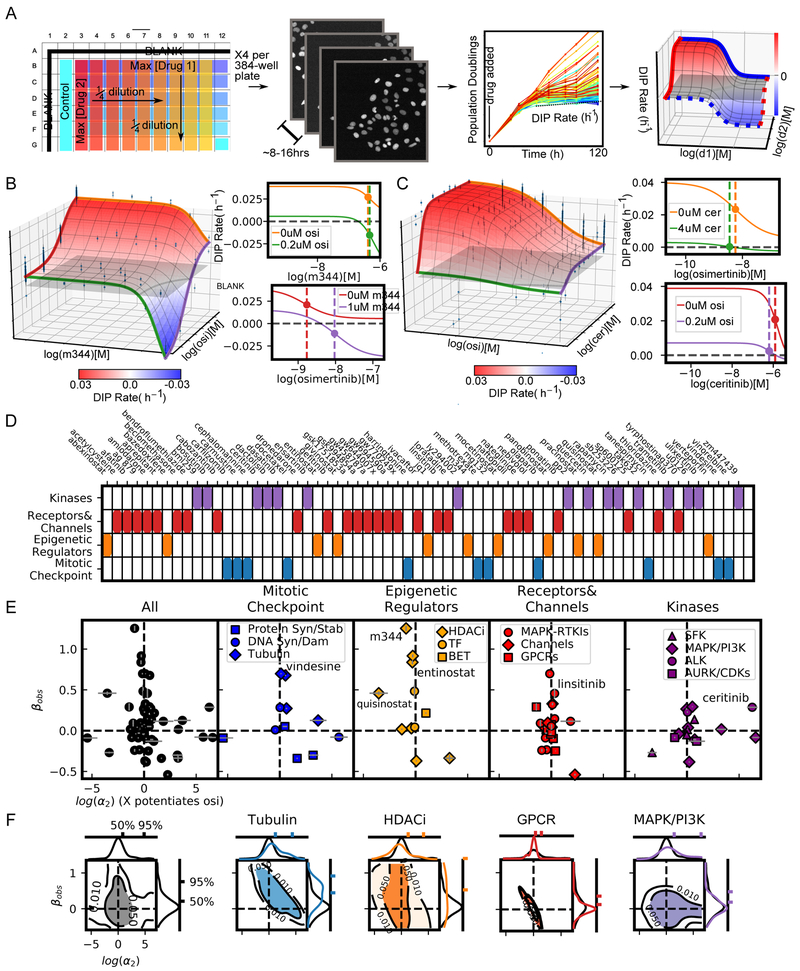
Figure 2: High throughput screen of 64 drugs combined with osimertinib (mutant EGFR-TKI) reveals drug class dependence of synergistic potency and efficacy in NSCLC.
A) High-throughput pipeline for generating dose-response surfaces. Initial drug matrix is prepared on a 384-well plate and transferred to cells seeded at sub confluent densities. Cells are engineered to express a fluorescently tagged histone (H2B-RFP) allowing for cell counts using automated segmentation software (See STAR Methods section Quantification and Statistical Analysis). Each condition is imaged every 6-8 hours resulting in growth curves. The growth curves are fit for the DIP rate (slope of dotted line) (Harris et al., 2016) to quantify drug effect. This matrix of DIP Rates is fit to the 2D Hill equation to extract synergy parameters. B) Combination surface of M344, an HDACi, and osimertinib (osi). Grey plane indicates a cytostatic growth rate (i.e., DIP rate=0 h−1). Left are the dose-response curves for each drug alone (orange and red curves) and each drug with the maximum tested concentration of the other (green and purple). Colors correspond to the colored lines on the combination surface. The dotted lines demarcate the EC50 for each curve. C) Combination surface for ceritinib (cer), an ALK, in combination with osimertinib. Ceritinib increases the potency of osimertinib at maximum tested concentration, as observed in the shift of the EC50 between orange and green curves in the top left panel. The shift is proportional to the concentration used and would, therefore, increase at higher concentrations; however, such concentrations are not physiologically realizable due to the low potency of ceritinib in this system (EC50=2.02 uM) highlighting the importance of interpreting synergistic potency in the context of the absolute potency. D) Drug panel used in combination with osimertinib grouped in 4 categories (see Table S2 for details). E) DSDs for drug combinations. The vertical axis quantifies the observed synergistic efficacy, (βobs). The horizontal axis (log(α2)) quantifies how osimertinib's potency is modulated by each drug (see Figure S4C for α1- α2 plot). Error bars represent the parameter uncertainty based on the MCMC optimization (See STAR Methods for description of fitting algorithm). F) 2D density plots and associated marginal distributions for βobs (vertical axis) and α2 (horizontal axis) for all drugs (black) and selected category subclasses. Colored tick marks indicate the 50% and 95% probability density intervals for each distribution.

