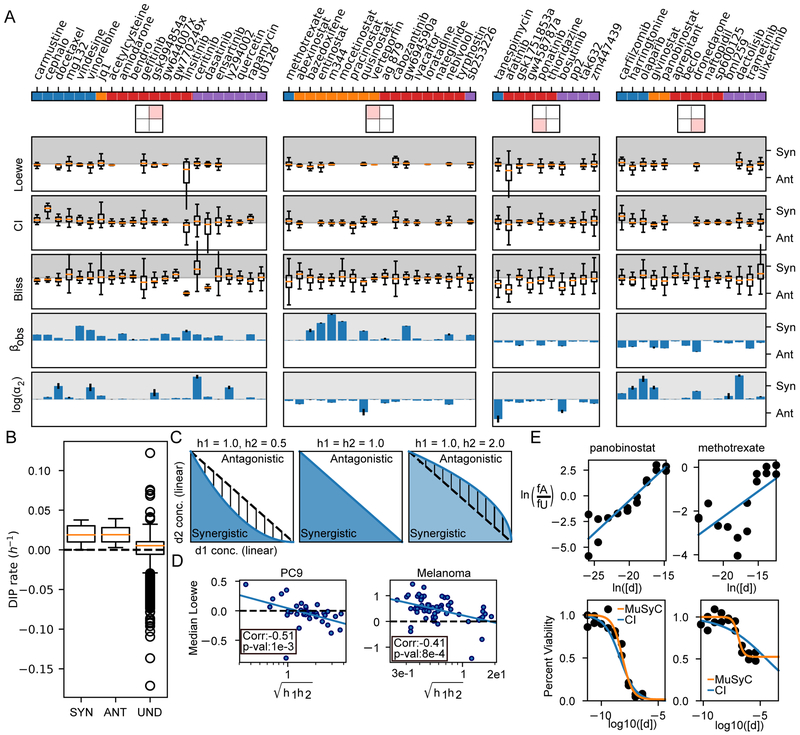
Figure 5: Biases and limitations of Loewe, CI, and Bliss.
A) Drugs are separated based on their DSD quadrant from Figure 2, and distributions of synergy calculated by Loewe, CI, and Bliss are shown. Loewe was calculated directly from DIP rates, while CI and Bliss were calculated from 72-hour viability (See STAR Methods section Methods Details). Overall, most combinations span synergism and antagonism when quantified by Loewe, CI, or Bliss. Conditions for which synergy could not be defined were removed. Traditionally, Loewe and CI are synergistic between 0 and 1, and antagonistic for values >1; however, for visualization, we transformed them to −log(Loewe) and −log(CI), so synergism (Syn) corresponds to positive numbers (grey region), antagonism (Ant) to negative (white region). α2 is the change in osimertinib’s potency due to the other drug. Error bars for βobs and log(α2) calculated from MCMC optimization. B) Loewe is undefined (Und) for all concentrations which achieved a net negative DIP rate. C) Loewe and CI assume the dose-response surface contours (i.e., the DIP rate axis comes out of the page) are linear (middle panel). The blue and white areas indicate regions which are synergistic and antagonistic respectively by MuSyC. When (left panel), Loewe and CI misclassify the hatched region as synergistic, while when (right panel), they misclassify the hatched region as antagonistic. D) As predicted, the median values of synergy calculated by Loewe are anti-correlated with the geometric mean of the hill slope in both the NSCLC and BRAF-mutant melanoma datasets. E) CI poorly fits drugs whose max effect is not equal to 0. The top panel shows linear dose-response fit by the CI algorithm, bottom shows the quality of fit in a standard dose-response view. The CI fit works well for drugs for which Emax ~= 0, like panobinostat (left, Emax=0.016, C=7.13 nM, h2=0.99 for orange fit, Emax=0, C=4.42 nM, h2=0.63 by CI). However, drugs with Emax >> 0, like methotrexate (right) lead to poor fits (Emax=0.52, C=0.119 uM, h2=1.88 by orange fit, Emax=0, C=34.7 uM, h2=0.23 by CI).

