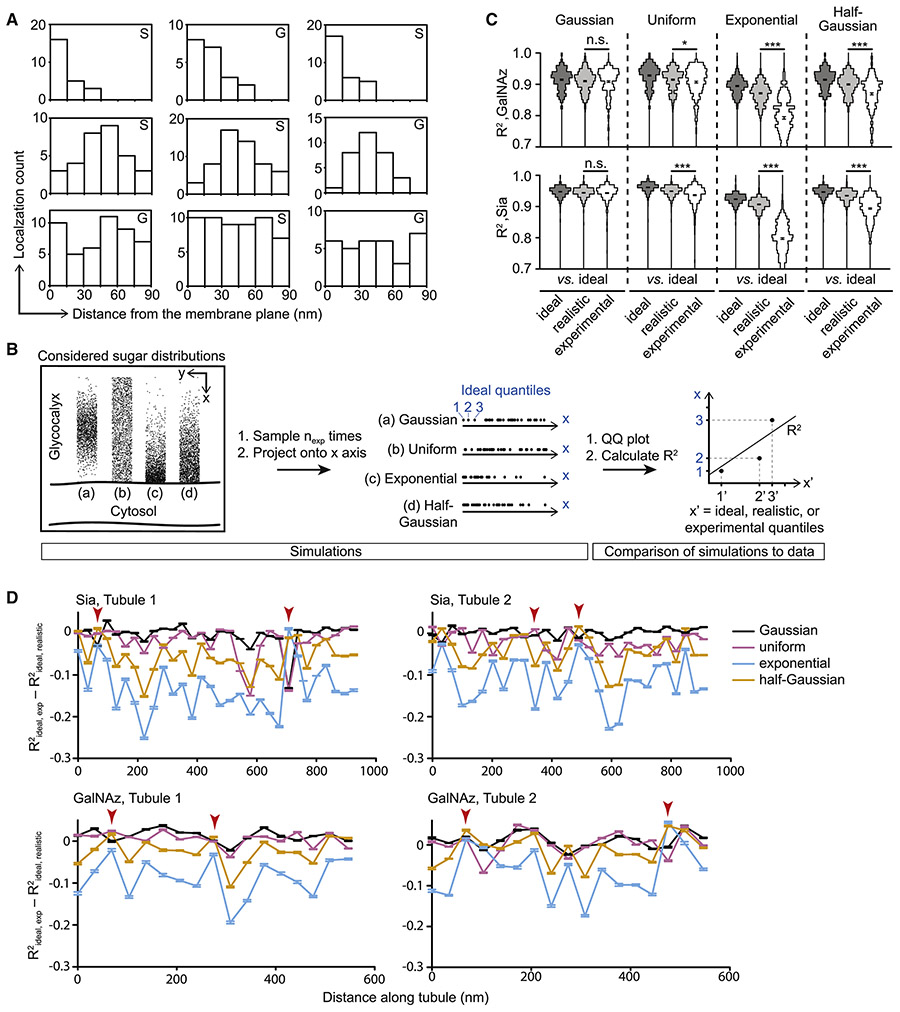
Figure 5. The glycocalyx exhibits a nanoscale architecture with sugar residues exhibiting a maximal density some distance away from the membrane.
(A) Nine representative localization distributions from single 90×30 nm windows along a single wall of GalNAz (G) or Sia (S)-labeled tubules. Top row depicts examples of exponential- or half-Gaussian-like distributions, middle row depicts Gaussian-like distributions, and bottom row depicts uniform-like distributions. (B) Schematic of analysis workflow for comparing possible ground truth sugar distributions with experimental localizations. (C) R2 values from QQ analysis shown binned as violin plots. Each of the twelve columns represents a comparison of two distributions (see x-axis labels). Analysis of GalNAz-labeled tubules is shown on top, and analysis of Sia-labeled tubules is shown on bottom. P-values are derived from t-tests of the means and standard deviations of the violin plots shown. Error bars: SEM; * = p < 0.05; *** = p < 0.0005. (D) Quantification of glycocalyx microheterogeneity along a single tubule wall. Values close to zero for R2ideal, exp minus R2ideal, realistic indicate good agreement between the experimental localization distribution and the simulated distribution to which it was compared. Arrowheads indicate example positions where the experimental data has a non-Gaussian sugar distribution.

