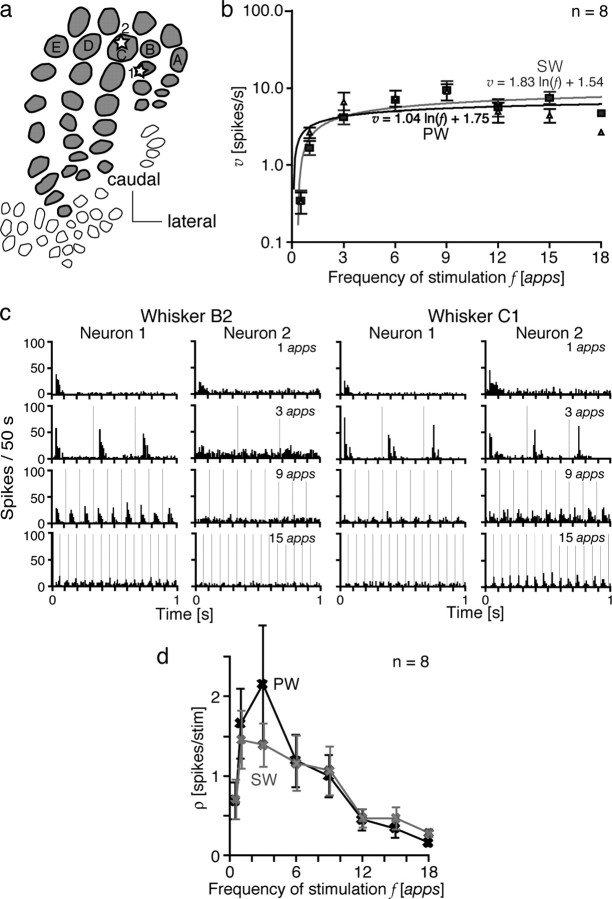
Figure 2.
Neural responses in adjacent barrel columns. a, Electrode 1 (star 1) was positioned in the column of barrel B2, and electrode 2 (star 2) was positioned in the column of barrel C1. b, The mean spike rates υ for the eight cells examined were plotted logarithmically against stimulus frequency f. Means, trend lines, and their equations are shown for responses to the deflection of whisker B1 or C1 as the PW (triangles, black line) or the SW (squares, gray line). c, Total PSTHs of exemplary neural responses are shown for each barrel column. The vertical thin lines indicate the onset of the whisker deflection. d, PW (black) deflection yielded a higher response efficacy ρ at peak than SW (gray) deflection. The bars through the means represent ±1 SD.

