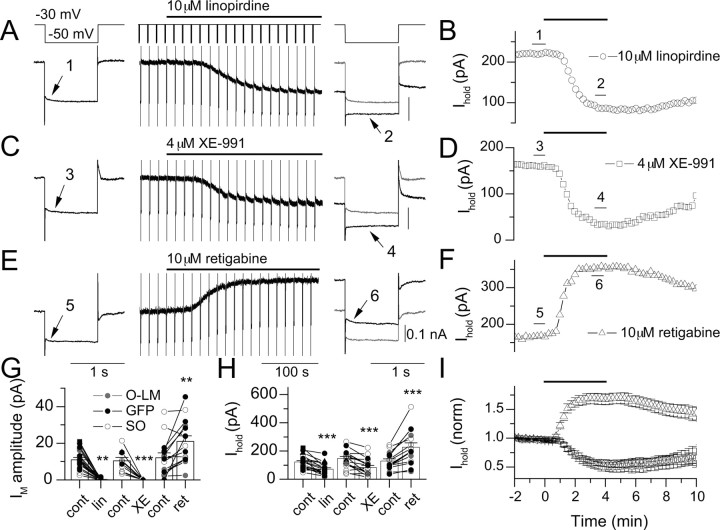
Figure 2.
Detection of IM in SO interneurons using linopirdine, XE-991, and retigabine. In VC, a step was applied from −30 to −50 mV at 15 s intervals. After a 2 min baseline period, a 4 min application of 10 μm linopirdine (A, B), 4 μm XE-991 (C, D), or 10 μm retigabine (E, F) was applied to the bath. Traces enumerated in A, C, and E are the average of three traces within a 45 s window as indicated by the bars in B, D, and F, respectively. Traces were filtered at 500 Hz for display. Control traces (gray) are overlaid for comparison with drug conditions (black). IM amplitudes (G) and Ihold (H) at −30 mV for mean data (columns) and individual cells (points) for linopirdine (n = 19), XE-991 (XE; n = 11), and retigabine (ret; n = 15) conditions are shown. Each condition in G and H was paired with its initial control value obtained in a 45 s window before the onset of application of the drug. GFP+ SO cells, anatomically identified O-LM cells, and unidentified SO cells are indicated by black symbols, gray symbols, and open symbols, respectively. I, Time course of changes in Ihold during application of linopirdine (circles), XE-991 (squares), or retigabine (triangles), normalized to the initial Ihold before drug application.

