
Figure 1.
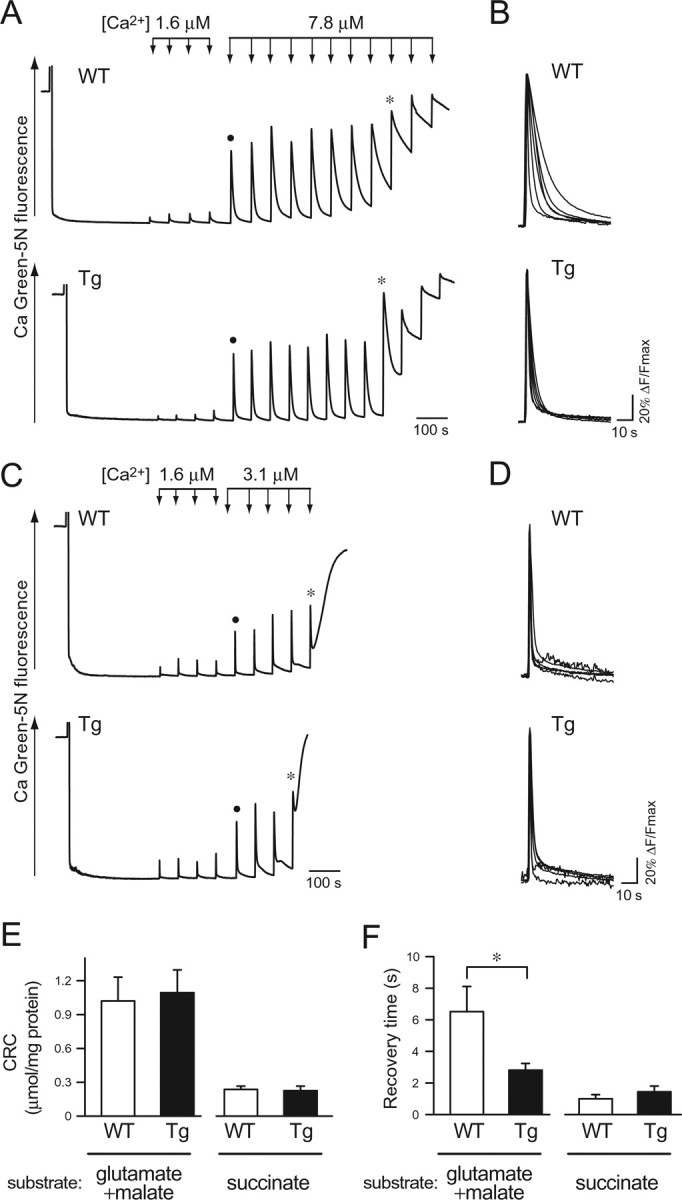
Mitochondrial CRC and uptake kinetics. A, CRC of mitochondria from wild-type (WT) and mutPOLG Tg (Tg) mice in a buffer containing 20 mm glutamate plus 2 mm malate, which is a substrate for complex I. Changes in extramitochondrial Ca2+ concentration ([Ca2+]exm) were monitored by a fluorescent Ca2+-sensitive dye, Calcium Green-5N. Ca2+ solution was applied by four additions at a final concentration of 1.6 μm (short arrows) and subsequent additions at a final concentration of 7.8 μm (long arrows) at 60 s intervals. An asterisk on the trace indicates the point at which Ca2+-overloaded mitochondria released Ca2+. A closed circle indicates the trace that was used for the analysis in B. The representative data of six experiments are shown. B, Kinetics of [Ca2+]exm responses in a buffer containing 20 mm glutamate plus 2 mm malate. The fluorescence changes in response to the first additions of 7.8 μm Ca2+ in six independent experiments were superimposed on an expanded timescale after normalization by maximal peak amplitude. C, CRC of mitochondria from wild-type (WT) and mutPOLG Tg (Tg) mice in a buffer containing 10 mm succinate, a substrate for complex II. Ca2+ solution was applied by four additions of 1.6 μm Ca2+ (short arrows) and subsequent additions of 3.1 μm Ca2+ (long arrows) at 60 s intervals. An asterisk on the trace indicates the point at which Ca2+-overloaded mitochondria released Ca2+. A closed circle indicates the trace that was used for the analysis in D. The representative data of seven independent experiments are shown. D, Kinetics of [Ca2+]exm responses in the buffer containing 10 mm succinate. The fluorescence changes in response to the first additions of 3.1 μm Ca2+ in six independent experiments were superimposed on an expanded timescale after normalization by maximal peak amplitude. E, Statistical analysis of results from the CRC assays in the buffer containing glutamate plus malate or succinate. Total amount of Ca2+ (micromoles of Ca2+ per milligram of protein) necessary to induce Ca2+ release was compared between mitochondria from wild-type (WT) and mutPOLG Tg (Tg) mice (n = 6). Data are expressed as mean ± SEM. F, Statistical analysis of the recovery times for Ca2+ uptake in two different conditions. Mitochondria from mutPOLG Tg (Tg) mice sequestered Ca2+ more rapidly than did those from wild-type (WT) mice (n = 6; *p < 0.05) when a CRC assay was performed in the buffer containing glutamate plus malate. Data are expressed as mean ± SEM.