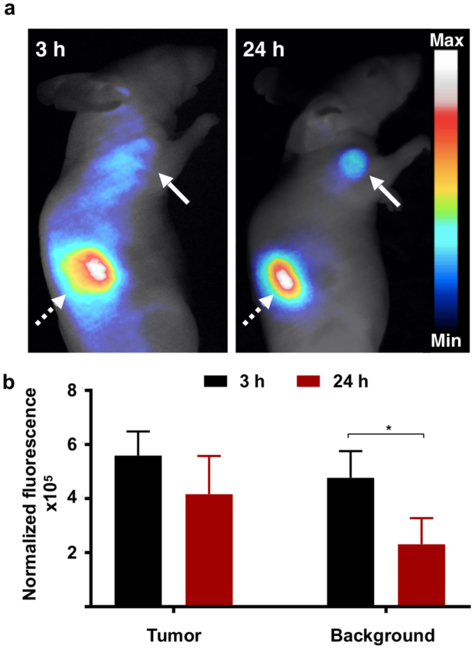
Figure 2. In vivo NIRF imaging of Ga-MMC(IR800)-TOC in mice.

(a) Representative NIRF images of Ga-MMC(IR800)-TOC were acquired in HCT116-SSTR2 xenografts at early and delayed time points using an EMCCD fluorescence imaging system. Solid arrows indicate tumor, dashed arrows indicate kidney. Background measurements were obtained near the hind limb. (b) Normalized fluorescence signal (displayed as counts/pixel2) in tumor and background tissue. *P < 0.005.
