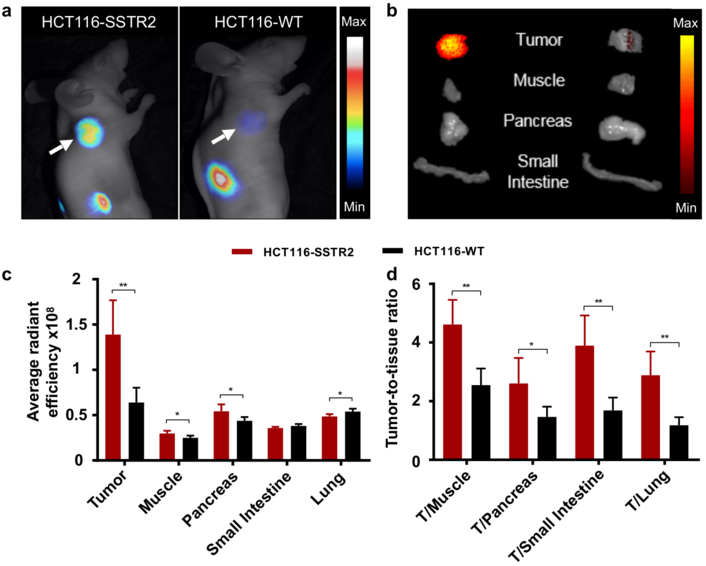
Figure 4. In vivo and ex vivo specificity of Ga-MMC(IR800)-TOC.

(a) In vivo NIRF imaging in HCT116-SSTR2 and HCT116-WT subcutaneous xenografts acquired 24 h post-injection (EMCCD), arrows indicate tumor. (b) Ex vivo NIRF imaging of selected organs (IVIS) and (c) tissue fluorescence determined from image analysis. (d) Optical contrast provided by the ratio of the average fluorescent signal in the tumor to sites of NET formation. *P < 0.05, **P < 0.01, ***P < 0.001. Data are presented as mean ± standard deviation (n=5). Average radiant efficiency displayed as ([p/s/cm2/sr]/[µW/cm2]).
