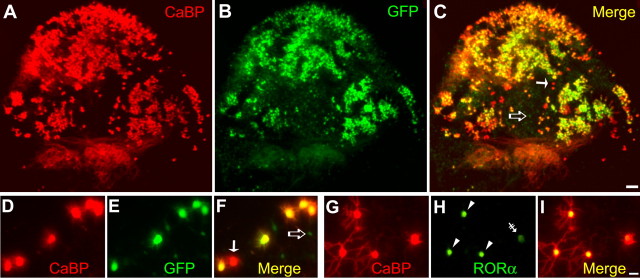
Figure 2.
Lentiviral-mediated transduction in organotypic cerebellar cultures. P0 plus 7 DIV cultured cerebellar slices at low (4×) magnification (A–C) or at higher (20×) magnification (D–I) infected with Lenti-GFP (A–F) or with Lenti-hRORα1 (G–I) vectors. A–F, PCs are visualized with PC-specific CaBP immunolabeling in red (A, C and D, F), and Lenti-GFP-transduced PCs are revealed by green GFP expression (B, C and E, F). GFP-expressing PCs appear as yellow cells in merged images (C, F). In C and F, white arrows indicate PCs nontransduced by the Lenti-GFP vector, and open arrows indicate non-PC GFP-expressing cells. G–I, PCs revealed in red (G, I), and RORα-expressing cells are immunolabeled in green (H, I). hRORα1-overexpressing PCs appear as red cells with intense yellow nuclei in the merged image (I). In H, arrowheads indicate Lenti-hRORα1-transduced cells with intense RORα immunolabeling, whereas the double-crossed arrow shows the weak intensity of RORα immunolabeling in a cell with endogenous RORα expression. Scale bars: A–C, 100 μm; D–I, 20 μm.

