Figure 3.
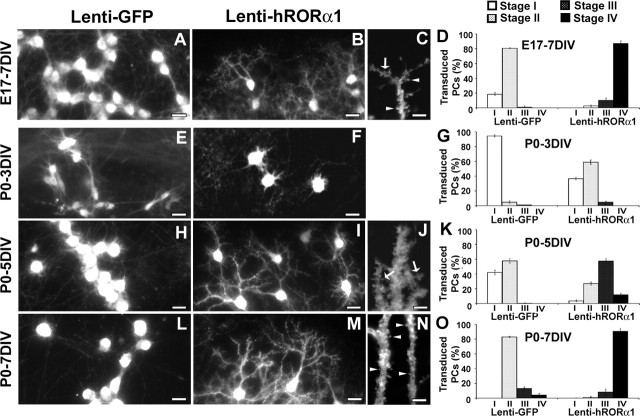
hRORα1 overexpression accelerates dendritic differentiation. Images of PCs in organotypic cultures at E17 plus 7 DIV (A–C), P0 plus 3 DIV PCs (E, F), P0 plus 5 DIV (H–J), and P0 plus 7 DIV PCs (L–N), revealed with CaBP immunolabeling. Slices were infected with either Lenti-GFP (A, E, H, L) or Lenti-hRORα1 (B, C, F, I, J, M, N) vectors. Transduced PCs were identified by GFP expression for Lenti-GFP or by RORα immunolabeling for Lenti-hRORα1 cultures. Note the presence of more mature hRORα1-overexpressing PCs compared with Lenti-GFP-expressing PCs. C, J, N, High-magnification view of dendrites of stage IV PCs at E17 plus 7 DIV, P0 plus 5 DIV, and P0 plus 7 DIV, showing filopodia (arrows) and spine-like structures (arrowheads). D, G, K, O, Quantitative distribution of PCs between stages I to IV (stages are defined in Fig. 1). For all culture times, the PCs undergo an accelerated differentiation when hRORα1 is overexpressed. Scale bars: A, B, E, F, H, I, L, M, 25 μm (magnification, 20×); C, J, N, 5 μm (magnification, 100×).

