Figure 2.
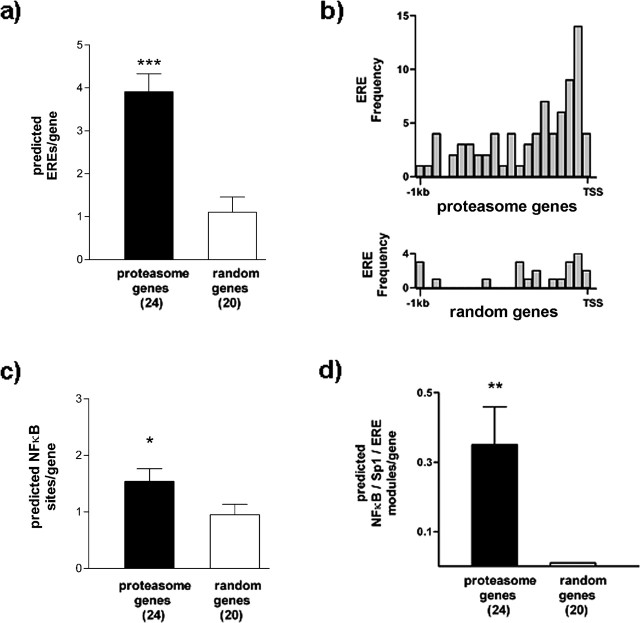
Bioinformatic analysis of candidate Zif268-regulated proteasome genes. The 1 kb upstream regions from the putative Zif268-regulated proteasome genes were compared with the equivalent regions from 20 randomly selected genes (see Materials and Methods and supplemental Table 2, available at www.jneurosci.org as supplemental material). The numbers of genes are shown in parentheses. a, The number of predicted EREs is significantly greater in the proteasome genes. ***p < 0.001 versus randomly selected genes (Mann–Whitney U test). b, Frequency distribution of EREs in proteasome genes (top) and randomly selected genes (bottom). EREs are concentrated immediately upstream of the TSS in the proteasome genes. c, The number of predicted NFκB binding sites is significantly greater in the proteasome genes. *p < 0.05 versus randomly selected genes (Mann–Whitney U test). d, The number of predicted NFκB/Sp1/ERE modules is significantly greater in the proteasome genes. For the randomly selected genes, no NFκB/Sp1/ERE modules were detected. **p < 0.001 versus 0 (Wilcoxon test). Results are shown as mean ± SEM.

