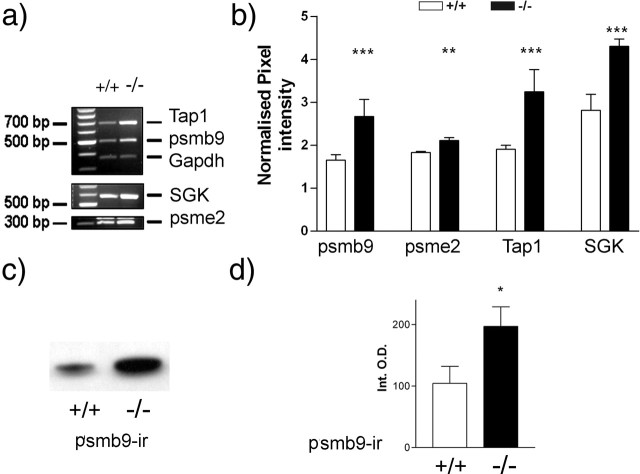
Figure 4.
Validation of psmb9, psme2, Tap1, and SGK regulation by Zif268 in Zif268 knock-out mice. Semiquantitative RT-PCR was used to determine the relative expression levels of the genes. a, Representative RT-PCR product band intensities for tissue from wild-type (+/+) and Zif268 knock-out (−/−) mice. b, Relative mRNA expression in cortical tissue isolated from age-matched Zif268 wild-type (□) and Zif268 knock-out (▪) mice. c, Western blot bands showing psmb9 immunoreactivity in cortical tissue from wild-type (+/+) and Zif268 knock-out (−/−) mice. d, Relative amounts of psmb9 immunoreactivity in cortical tissue isolated from age-matched Zif268 wild-type (□) and Zif268 knock-out (▪) mice. The results are normalized pixel intensity (relative to Gapdh signal intensity) (b) or integrated band optical density (d) and are mean ± SEM: *p < 0.05, **p < 0.01, ***p < 0.001, expression levels greater in knock-out mice compared with wild-type mice (Mann–Whitney U test).

