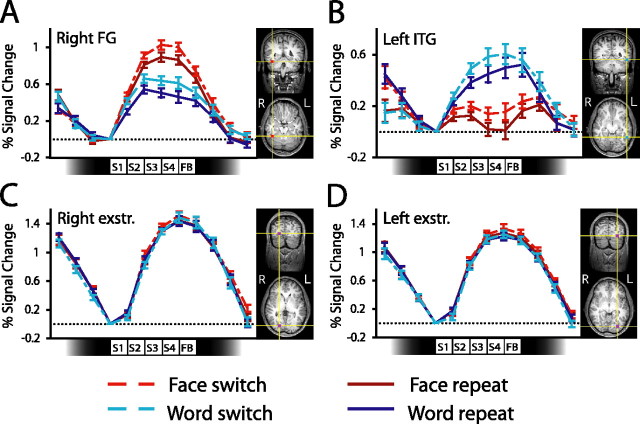
Figure 3.
Activity in posterior cortical regions during switching. Each panel shows event-related activity (percent signal change) averaged across subjects together with ROI locations from one example subject. Event-related averages are shown separately for each task for switch and repeat miniblocks. Data are shown for the face-selective region in right FG (A), left ITG (B), and extrastriate (exstr.) regions in the right (C) and left (D) hemispheres. The icons along the abscissa of each graph indicate the timings of the presentation of each of the four stimuli in each miniblock. SE bars are shown for the contrast between switch and repeat miniblocks, calculated separately for each task. S, Stimulus; FB, feedback.

