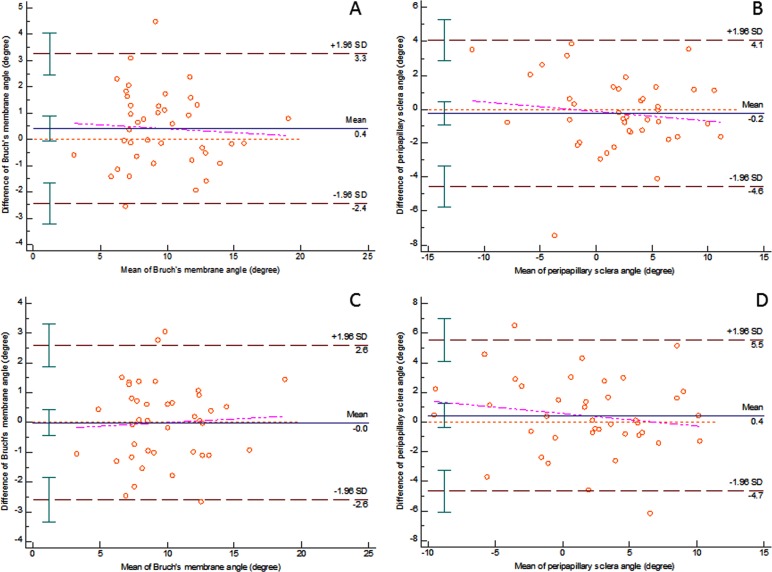
Figure 3.
Bland-Altman plots of intra- and interobserver repeatability of image grading
Intraobserver repeatability of image grading of Bruch's membrane angle (A) and the peripapillary scleral angle (B); interobserver repeatability of image grading of Bruch's membrane angle (C) and the peripapillary scleral angle (D) are illustrated. The pink lines represent the regression lines of differences and the brown red lines indicate the 95% confidence interval of limits of agreement.

