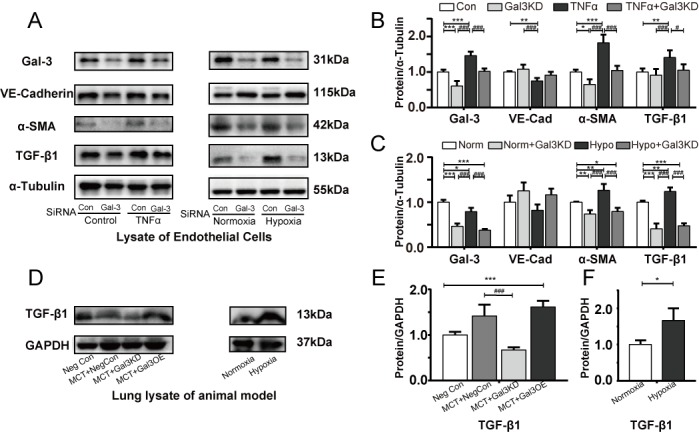
Figure 6. Gal-3 inhibition reverses EndoMT in these models.

Representative immunoblots and relative densitometric analysis of EndoMT relative proteins. (A, C) hPAECs transfected with Non-targeting (Con) siRNA or Gal-3 SiRNA and exposed to TNFα (10 ng/ml) for 48 hours compared with controls (n=5). (B, D) hPAECs transfected Con and Gal-3 SiRNA followed by normoxia (21% O2) or hypoxia (0.5% O2) for 48 h (n=5). and (E, G) whole lung lysates of Neg Con, MCT+ Neg Con, MCT+Gal3KD, MCT+Gal3OE PAH model (n=5). (F, H) Immunoblots and quantification of lung lysates of normoxia (21% O2) and hypoxia rats (10% O2), GAPDH and α-Tubulin were used as loading control. Bars represent mean ± SEM. *, **, and *** indicate p < 0.05, p < 0.01, and p < 0.001, respectively, comparing Control group (Neg Con lung, Con PAEC, Normoxia rat lung or Normoxia PAEC); #, ##, and ### indicate p < 0.05, p < 0.01, and p<0.001, respectively, comparing the PAH related stimuli (MCT+ Neg Con rat lung, PAEC after TNFα, hypoxia lung or hypoxia PAEC. Gal-3, Galectin-3; PH, pulmonary hypertension; MCT, monocrotaline; TNFα, tumor necrosis factor α; EndoMT Endothelial-mesenchymal transition; α-SMA, α smooth muscle actin; PA, pulmonary artery; PAEC pulmonary artery endothelial cell; Norm, Normoxia; Hypo, Hypoxia; Student’s t-test was used for comparing differences in normoxia and hypoxia groups. Analyses were performed by one-way ANOVA and Bonferroni post hoc.
