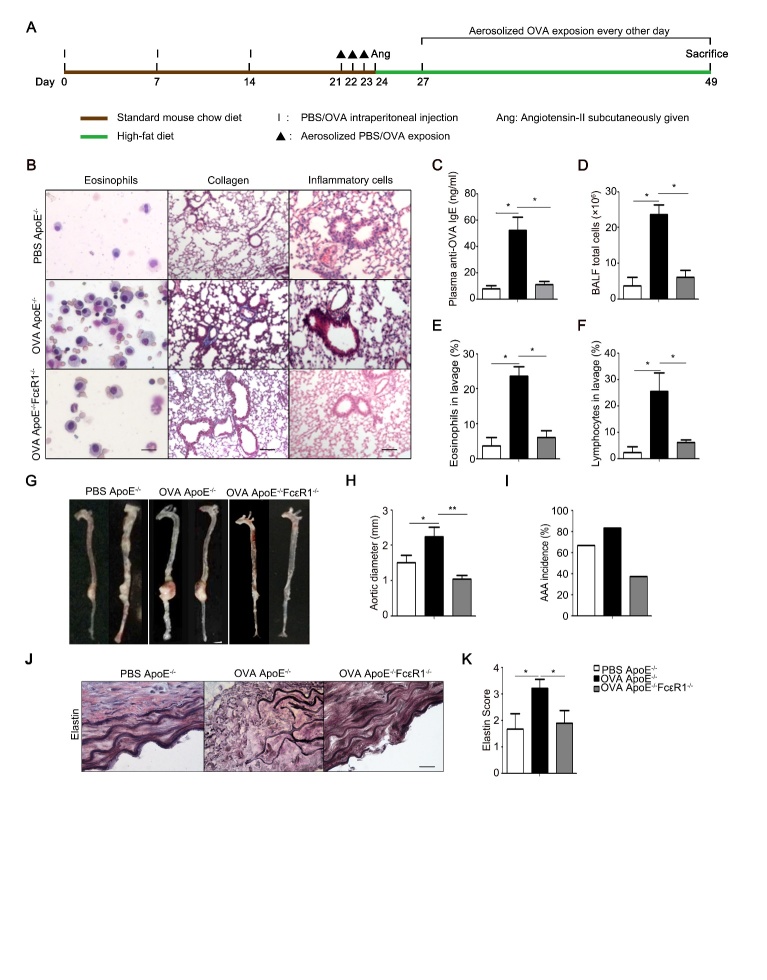
Figure 1. Effect of IgE receptor, FcɛR1, on asthma-accelerated AAA.
(A) Schematic diagram for the mouse model of asthma-accelerated AAA. (B) Representative pictures from Giemsa staining for bronchial-alveolar lavage fluid (BALF) cell, and Masson staining and H&E staining for lung tissue. Eosinophils Scale bars: 100μm. Collagen Scale bars: 50μm. Inflammation cells Scale bars: 50μm; (C) Anti-OVA IgE levels in serum; (D) Total number of cells in BALF; (E) Percentage of eosinophils in BALF; (F) Percentage of lymphocytes in BALF. (G) Images of mouse aorta of ApoE-/-mice treated with or without OVA, and ApoE-/-FcɛR1-/- mice treated with OVA. (H) The average diameters of the AAA. (I) The incidence rate of AAA in ApoE-/-, OVA-treated ApoE-/-, and OVA-treated ApoE-/-FcɛR1-/- mice. (J) Representative staining for elastin at AAA lesions where the most severe elastin degradation occurred. Scale bars: 100μm. (K) Scores from the elastin degradation classification for AAA lesions of the mice with the indicated genotype. Data information: In (C-F, H, I, K), data are presented as mean ± SEM (n=15 per group). *P < 0.05; **P<0.01

