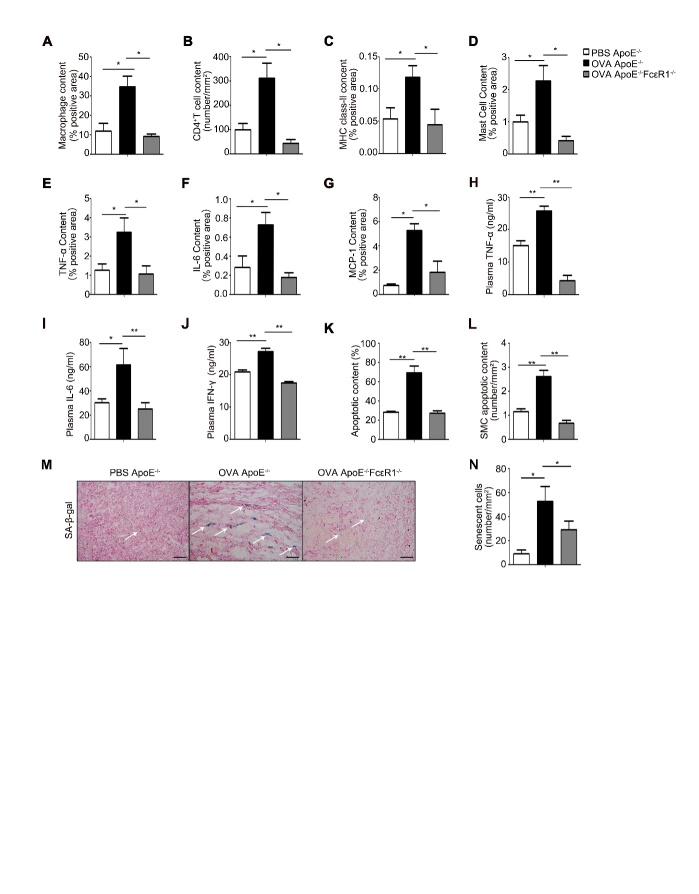
Figure 2. Inflammation and remodeling in AAA lesion.
(A-G) AAA lesion macrophage content (A); CD4+ T-cell content (B); major histocompatibility complex (MHC) class-II-positive area (C); mast cell content (D); and chemokine TNF-α-positive area (E); IL-6-positive area (F); and MCP-1-positive area (G) from ApoE-/-mice treated with or without OVA, and from OVA-treated ApoE-/-FcɛR1-/- mice. (H-J) The expression of plasma inflammatory factors, TNF-α (H), IL-6 (I), and IFN-γ (J) in serum from PBS ApoE-/-, OVA ApoE-/- and OVA ApoE-/-FcɛR1-/- mice; (K) Statistic analysis of TUNEL staining for apoptotic cells in the AAA tissue from ApoE-/-mice treated with or without OVA, and from OVA-treated ApoE-/-FcɛR1-/- mice. (L) Cell content of apoptotic vascular smooth muscle cell in AAA lesion from PBS ApoE-/-, OVA ApoE-/- and OVA ApoE-/-FcɛR1-/- mice. (M) Representative picture of β-galactosidase staining for senescent cells in AAA lesions. Scale bars: 25μm. (N) Counts for senescent cells/mm2 in the AAA lesions. Data information: Data are presented as mean ± SEM (n=15 per group). *P < 0.05; **P<0.01.

