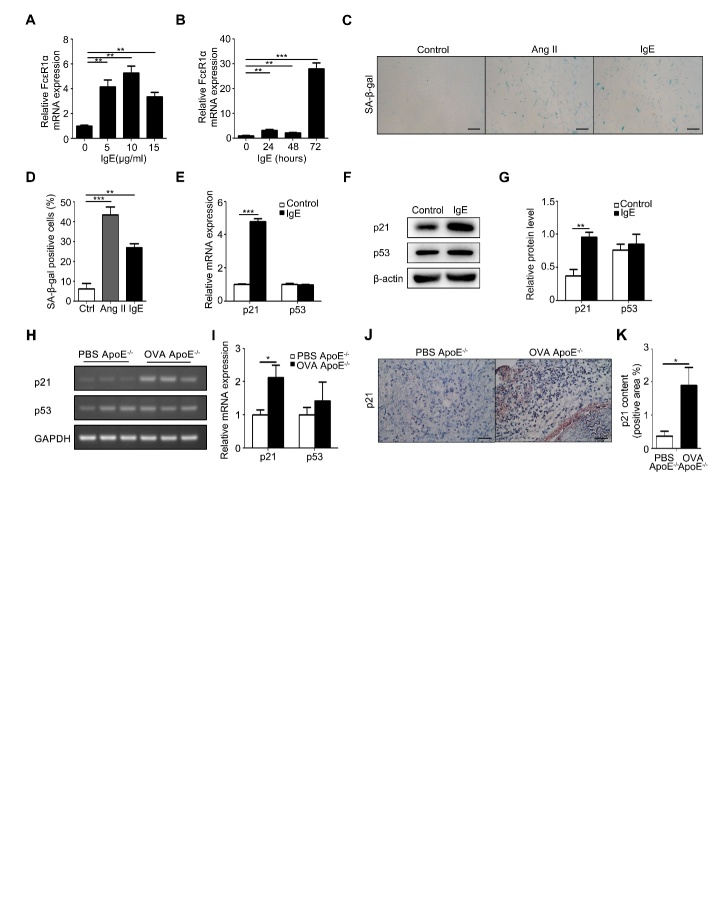
Figure 3. IgE effect on senescence of vascular SMCs in vitro and in vivo.
(A) RT-PCR detection of FceR1α expression at different doses of IgE stimulation. (B) RT-PCR detection of FceR1α expression at different times of IgE stimulation. (C) Representative images from β-galactosidase staining of human vascular smooth under the indicated conditions. Scale bars: 100 μm. (D) The statistics of the results from C. (E) RT-PCR detection of p21 and p53 mRNA expression in IgE-stimulated HSMCs. (F) Western blotting analysis of p21 and p53 expression in human vascular smooth muscle cells stimulated by IgE. (G) Statistical analysis on the relative intensities of p21 and p53 bands in the Western blotting of human vascular smooth muscle cells stimulated by IgE. (H) The expression of p21 and p53 mRNA in human vascular smooth muscle cells stimulated by IgE. (I) RT-PCR detection of p21 and p53 mRNA expression in human vascular smooth muscle cells stimulated by IgE (J) Representative pictures of p21 immunohistochemical staining in AAA lesions. Scale bars: 25μm. (K) The statistical analysis of p21 immunohistochemical staining in AAA lesions. Data information: Data are presented as mean ± SEM (animal tissues; n=15 per group). *P < 0.05; **P<0.01

