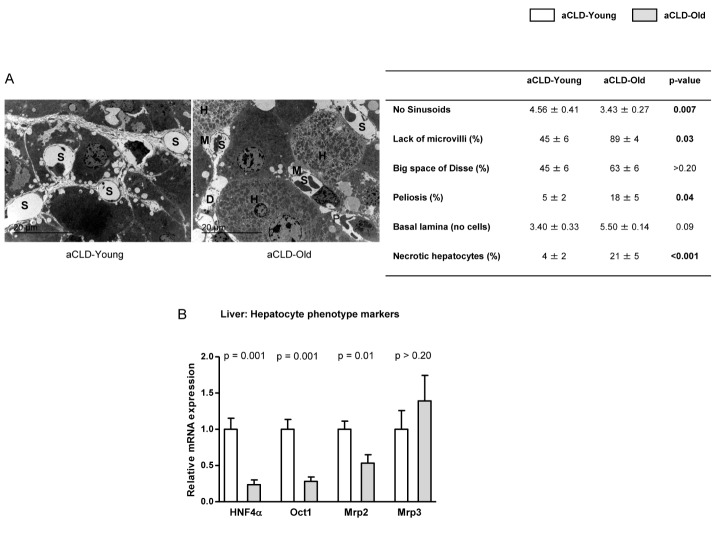
Figure 1. Hepatocyte phenotype markers in 4 months-young and 20 months-old rats with aCLD.
(A) Representative transmission electron microscopy images and corresponding quantification of numbers of sinusoids (S), lack of microvilli (M), big space of Disse (D), peliosis(P), basal lamina deposition and number of necrotic hepatocytes (H) in liver tissue from 4 months-young and 20 months-old rats with aCLD. (B) HNF4α, Oct1, Mrp2 and Mrp3 mRNA expression in livers described in A. n=3 (A) and (B) n=7 per group. Results represent mean ± S.E.M. All images: 3000X, scale bar=20μm.

