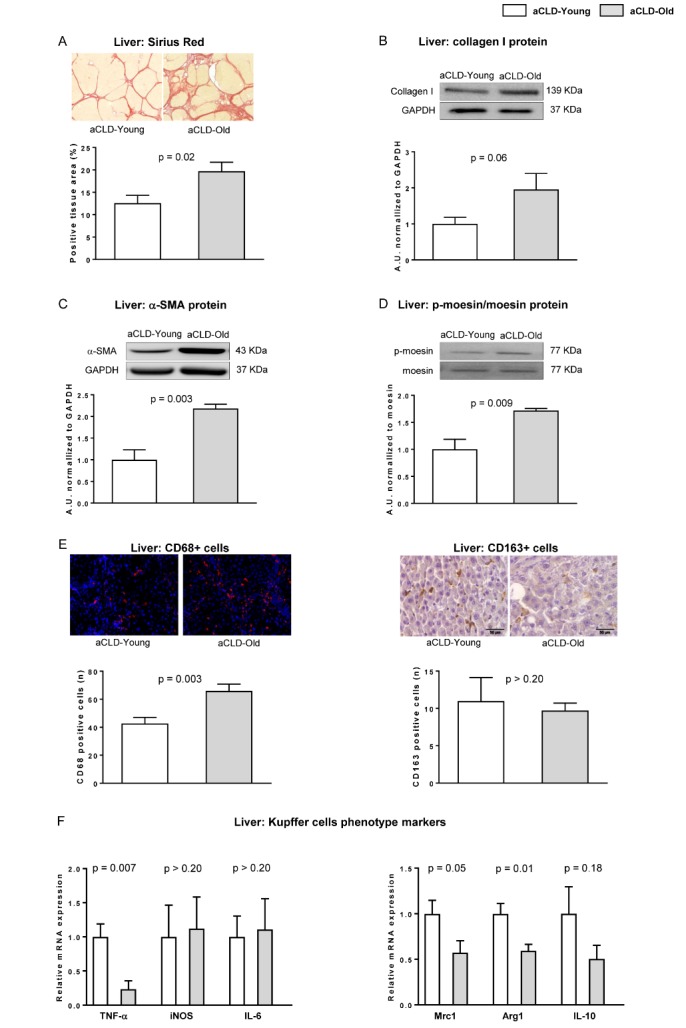
Figure 3. Aging increases fibrotic deposition, HSC activation and macrophages infiltration.

Fibrotic content, HSC phenotype and macrophage infiltration and phenotype were evaluated in young and aged rats with aCLD. (A) Representative images of fibrotic content measured as positive area for Sirius Red with their corresponding quantifications. (B) Representative western blot of Collagen I normalized to GAPDH. (C) Representative western blot of α-SMA normalized to GAPDH. (D) Representative western blots of moesin and p-moesin and corresponding quantification. (E) Left, representative images of CD68 immunofluorescence in liver tissue and corresponding quantification. Right, representative images of CD163 immunohistochemistry in liver tissue and its quantification. (F) Expression of TNF-α, iNOS, and IL-6 as pro-inflammatory markers (left) and Mrc1, Arg1 and IL-10 as anti-inflammatory markers (right) in liver tissue from young and old rats with aCLD. n=7 per group. Results represent mean ± S.E.M. All images: 400X, scale bar=50μm.
