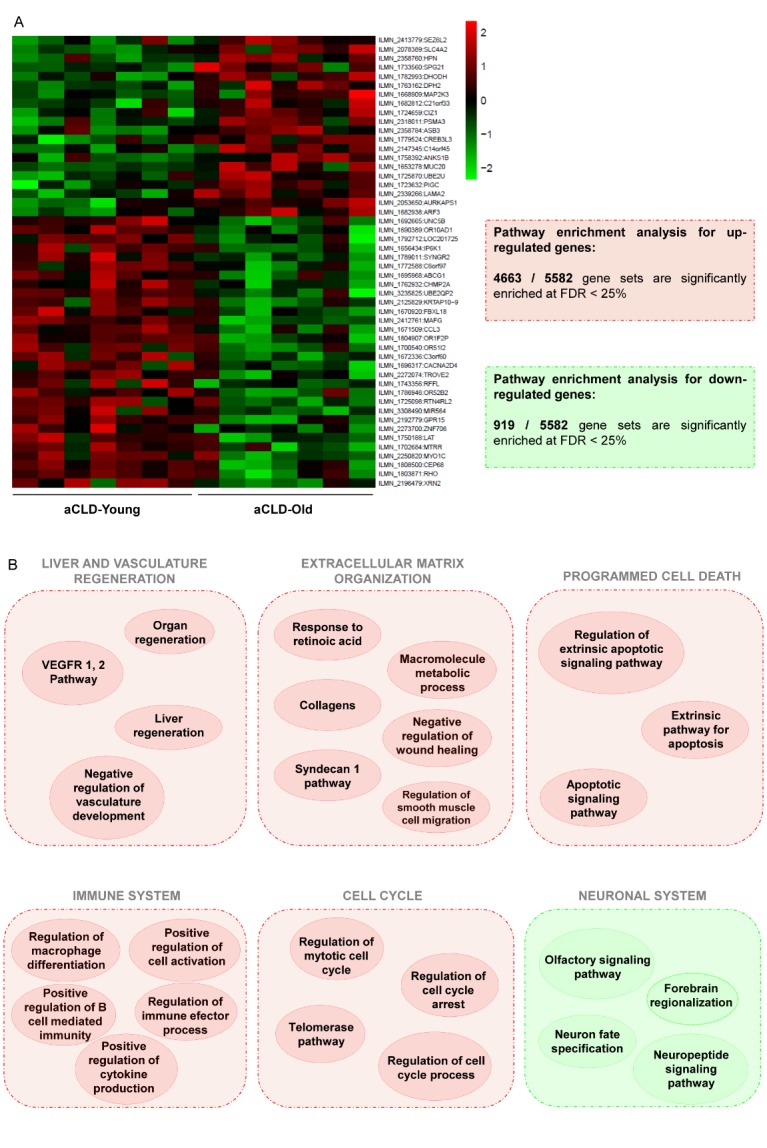
Figure 4. Aged-related changes in the gene signature of cirrhotic human liver.

Gene expression analysis in cirrhotic young and old human livers. (A) Left, fold enrichments (log2) are plotted in a heatmap using red colour for transcripts that are increased or using green colour for transcripts that are decreased in old cirrhotic humans. Right, pathway enrichment analysis results for genes upregulated (red) and downregulated (green) are summarized. (B) Representative gene sets upregulated (red) or downregulated (green) related to microcirculatory function in old cirrhotic humans, full description of top ten gene sets can be found in supplementary materials. FDR < 10%, n=7 per group. Clinical characteristics of donors are described in Supplementary table 1.
