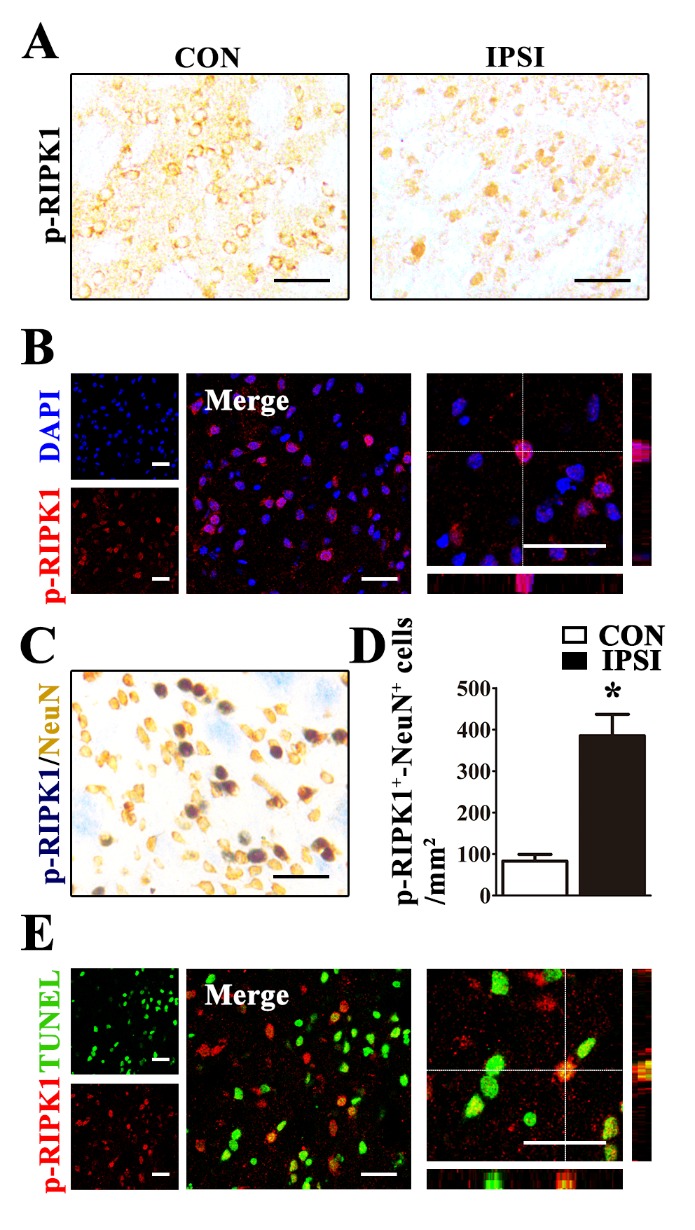
Figure 2. Distribution of phosphorylated RIPK1 (Ser166) in the ischemic rat brain.

(A) Morphology of p-RIPK1 positive (p-RIPK1+) cells in the contralateral (CON) and the ipsilateral (IPSI) striatum at 24 h after MCAO. (B) p-RIPK1+ (red) signals co-localized with DAPI (blue) in the ipsilateral striatum of rats at 24 h after MCAO. (C) p-RIPK1 and NeuN double positive (p-RIPK1+-NeuN+) neurons in the ipsilateral striatum at 24 h after MCAO. (D) The number of p-RIPK1+-NeuN+ neurons increased in the ipsilateral (IPSI) compared with the contralateral (CON) striatum at 24 h after MCAO (n=5). *p<0.05. (E) p-RIPK1+ signals co-localized with TUNEL stain (green) in the ipsilateral striatum at 24 h after MCAO. Both black and white scale bars in all figures represent 50 μm.
