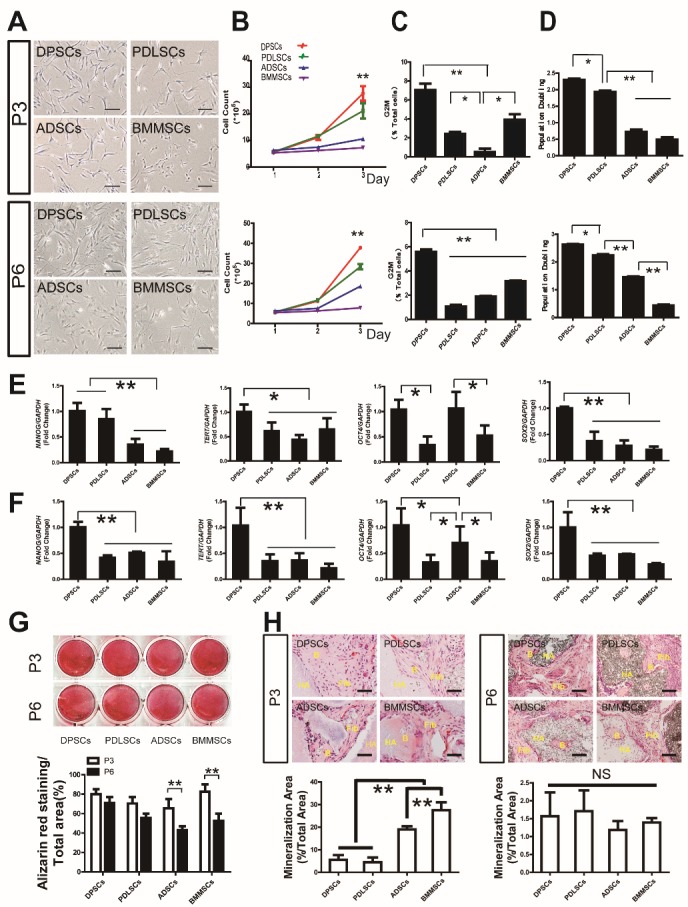
Figure 1. DPSCs have higher proliferation and osteogenic capability maintenance compared to PDLSCs, ADSCs, and BMMSCs during aging.

(A) Gross view of different MSCs at passages three and six. (B) Cell count analysis showed that both passage three and six DPSCs have a higher proliferation rate than that of other stem cells. (C) Cell cycle analysis also indicated more DPSCs at G2 phase compared to other stem cells at both passage three and six. (D) Population doubling of different MSCs at passage three and passage six showed that DPSCs have a higher PD value. (E, F) Real-time RT-PCR analysis revealed that NANOG, SOX2, TERT, and OCT4 were expressed at higher levels in passage three and six DPSCs than in the other stem cells. (G) Alizarin Red staining and quantitative measurement revealed no significant difference in mineralization of DPSCs, PDLSCs, ADSCs and BMMSCs at passage three, while both ADSCs and BMMSCs of passage six exhibited declined mineralization potential and were lower compared to DPSCs and PDLSCs. (H) ADSCs and BMMSCs showed higher osteogenesis ability in vivo than DPSCs and PDLSCs of passage three, with no significant difference among groups at passage six. Values are means ± SDs. One-way ANOVA was used to determine statistical significance. Error bars represent SDs (n = 5). *P ≤ 0.05; **P ≤ 0.01; NS: no significance. Scale bar: 100 μm. B: bone-like tissue, Fib: fibrous tissue, HA: hydroxyapatite/ tricalciumphosphate.
