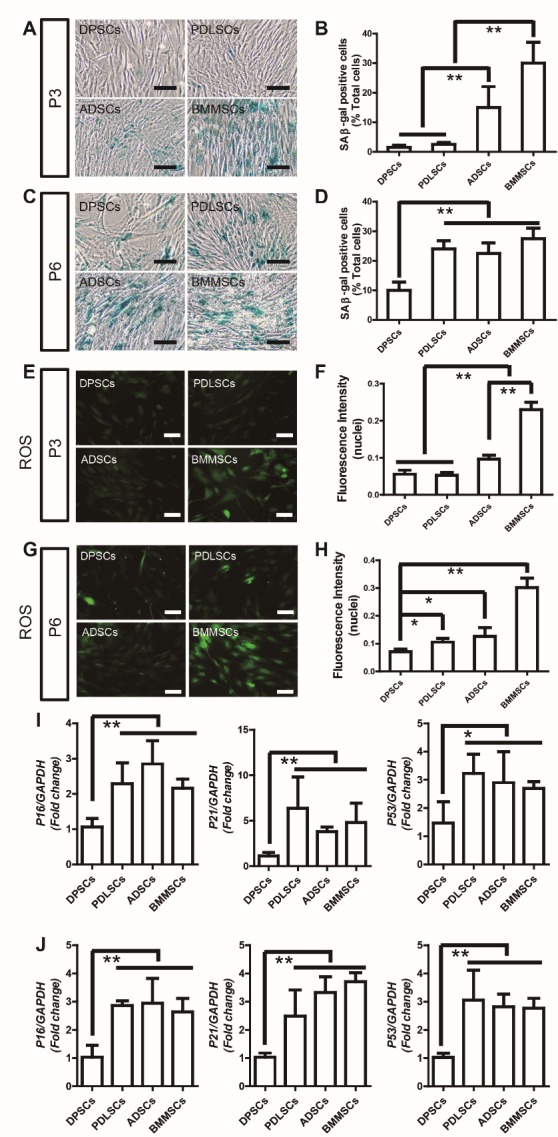
Figure 2. DPSCS show higher ability for senescence resistance than PDLSCs, ADSCs, and BMMSCs.

(A) Senescence-associated β-galactosidase (SA β-gal) staining of DPSCs, PDLSCs, ADSCs, and BMMSCs at passage three. (B) Quantitative analysis indicated significantly more SA β-gal-positive cells in passage three BMMSCs and ADSCs compared to DPSCs and PDLSCs. (C) SA β-gal staining of DPSCs, PDLSCs, ADSCs, and BMMSCs at passage six. (D) Quantitative analysis indicated significantly more SA β-gal-positive cells in passage six PDLSCs, BMMSCs, and ADSCs compared to DPSCs. (E) Reactive oxygen species (ROS) staining of DPSCs, PDLSCs, ADSCs, and BMMSCs at passage three. (F) Quantitative analysis indicated significantly lower ROS generation in passage three DPSCs and PDLSCs compared to ADSCs and BMMSCs. (G) ROS staining of DPSCs, PDLSCs, ADSCs, and BMMSCs at passage six. (H) Quantitative analysis indicated significantly lower ROS generation in passage six DPSCs compared to PDLSCs, ADSCs, and BMMSCs. (I) Real-time RT-PCR analysis revealed that theP16, P21, P53 were downregulated in DPSCs compared to other MSCs at passage three. (J) Real-time RT-PCR analysis revealed that theP16, P21, P53 were downregulated in DPSCs compared to other MSCs at passage six. Values are means ± SDs. One-way ANOVA was used to determine statistical significance. Error bars represent SDs (n = 5). *P ≤ 0.05; **P ≤ 0.01. Scale bar: 100 μm.
