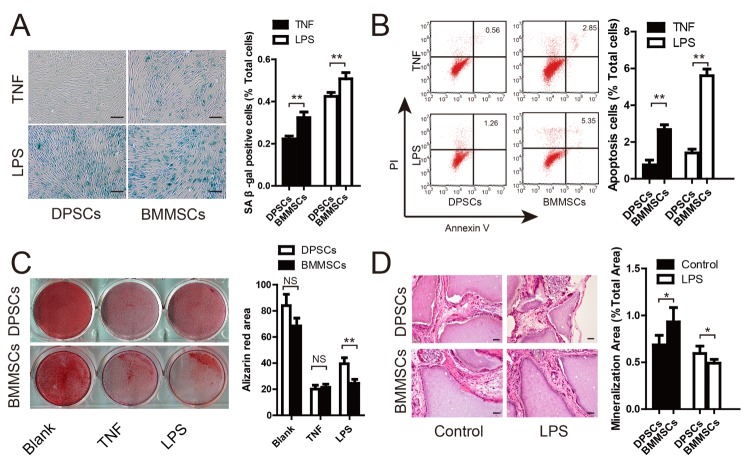
Figure 4. DPSCs show higher resistance to LPS-induced senescence and dysfunction of osteogenesis compared to BMMSCs.
(A) SA β-gal staining of DPSCs and BMMSCs under TNFα and LPS stimulation. Quantitative analysis indicated significantly more SA β-gal-positive cells in BMMSCs compared to DPSCs under TNFα and LPS stimulation. (B) Annexin V/PI staining and quantitative analysis showed lower rates of cell apoptosis in DPSCs than BMMSCs under LPS and TNFα stimulation. (C) Alizarin Red staining and quantitative measurements of osteogenesis of DPSCs and BMMSCs under LPS and TNFα stimulation. (D) HE staining and quantitative measurements of the osteogenic property of DPSCs and BMMSCs in vivo under LPS and TNFα stimulation. Values are means ± SDs. Student’s t-tests were used to determine statistical significance. Error bars represent SDs (n = 5). *P ≤ 0.05; **P ≤ 0.01; NS: no significance. Scale bar: 100 μm.

