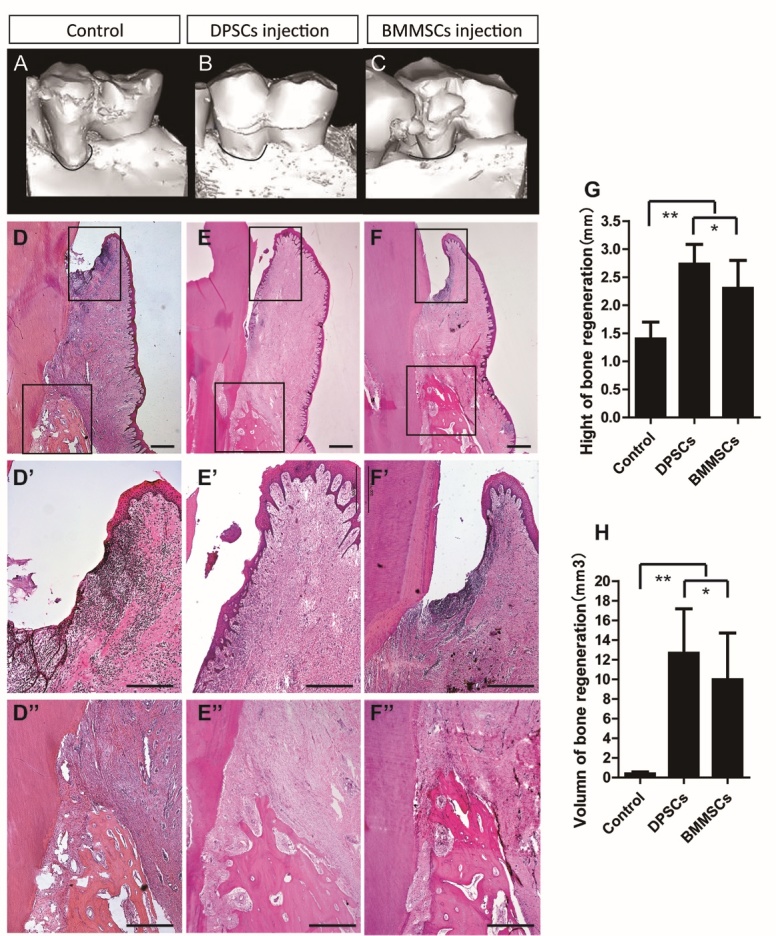
Figure 5. More hard tissue regeneration in the periodontium after DPSCs injection compared to BMMSCs injection in vivo.

(A-C) Gross micro-CT view of periodontal defect regeneration in the control group (saline injection), DPSC group, and BMMSC group. (D-F) Histopathological assessment of periodontal bone regeneration by HE staining in the periodontal defects of the DPSCs group and BMMSCs group. (D’-F’) Impaired sulcular epithelia and lymphocyte infiltration were evident in the control group compared with the DPSCs and BMMSCs groups. (D’’-F’’, G, H) Alveolar bone heights in the DPSCs and BMMSCs groups were much larger than those of the control group. Values are means ± SDs. One-way ANOVA was used to determine statistical significance. Error bars represent SDs (n = 5). *P ≤ 0.05; **P ≤ 0.01. Scale bar: 100 μm.
