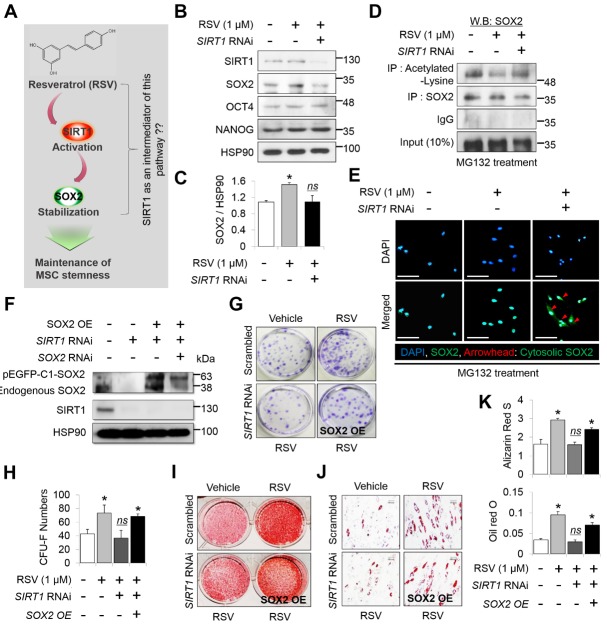
Figure 3. RSV treatment stabilizes SOX2 protein levels in MSCs depending on the presence of SIRT1.
(A) Expected model of the mechanism of RSV action on the regulation and maintenance of MSC stemness via SIRT1-SOX2 axis. (B) Protein levels of SIRT1, SOX2, OCT4, and NANOG were quantified by western blot analysis and normalized to that of HSP90. (C) Quantitative analysis of SOX2 protein was performed by ImageJ software (n = 3, in triplicate per donor). *, p < 0.05, ns; not significant compared to control. MSCs of 4th passage were used for this western blot. (D) Immunoprecipitation was conducted in the presence of MG132. To confirm acetylated-lysine and SOX2, each protein was immunoprecipitated using antibodies targeting each protein followed by western blotting using an anti-SOX2 antibody (n = 3, in triplicate per donor). All study groups were treated with MG132 (10 µM), a proteasome inhibitor. MSCs of 4th passage were used for immunoprecipitation. (E) Immunocytochemistry was conducted to observe cellular localization of SOX2 from the nucleus to the cytoplasm, following SIRT1 knockdown in the presence of RSV (n = 3, in triplicate per donor). To inhibit proteasomal degradation of SOX2, all study groups were treated with MG132 (10 µM). Nucleus was stained with DAPI, and images were captured by confocal microscopy. Red arrowhead indicates nuclear exports of SOX2 protein. Scale bar = 50 μm. MSCs of 4th passage were used for immunocytochemistry. (F) Efficiency of SIRT1 knockdown or SOX2 overexpression was confirmed by western blot analysis in MSCs (n = 3, in triplicate per donor). MSCs of 4th passage were used for this western blot. (G) Colony-forming cells were detected by CV staining, and (H) the number was counted by three observers (lower panel) (n = 3, in triplicate per donor). *, p < 0.05. Alizarin red S (I) and oil red O (J) staining was conducted to compare mineralization and accumulation of lipid droplets. (K) Quantitative analysis for mineralization was measured at 595 nm absorbance (lower panel). *, p < 0.05. Lipid droplets were quantified with ImageJ software (n = 3, in triplicate per donor). Scale bar = 60 µm. *, p < 0.05. MSCs of 12th passage were used for CV, alizarin red S, and oil red O stains.

