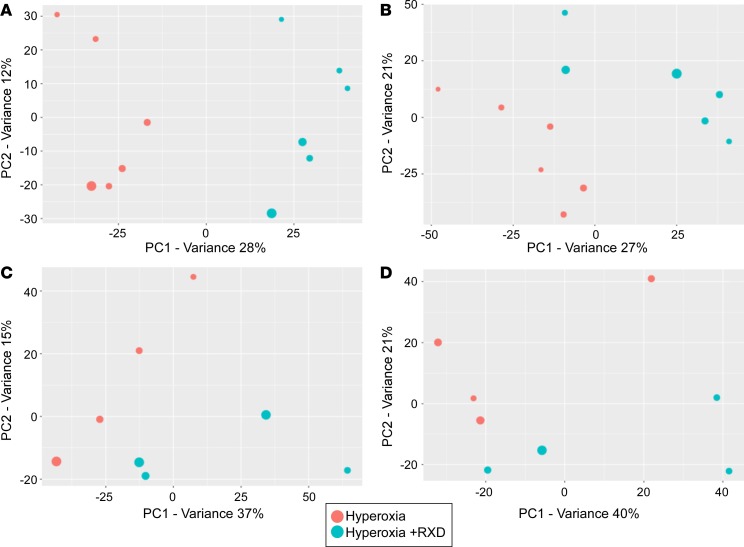
Figure 1. Multivariate statistical analysis of metabolite features indicates difference in PBS (control) versus Roxadustat (treated) hyperoxic mice, in plasma and retina metabolome.
All the data in this figure are from mice dissected on postnatal day 10. Metabolites from retina (n = 4, each group) and plasma (n = 6, each group) of these mice were extracted and analyzed using LC-MS/MS. Multidimensional data were analyzed using PCA (A–D). The size of the dot represents DModX value for each sample. DModX represents distance of each observation to the model plane and helps in determination of potential outliers, which in our case were absent. (A) PCA score plot of positive ionization mode plasma metabolite features of principal component 1 (PC1) versus PC2. (B) PCA score plot of negative ionization mode plasma data. (C) PCA score plot of positive ionization mode retina data. (D) PCA score plot of negative ionization mode retina data. RXD, Roxadustat.

