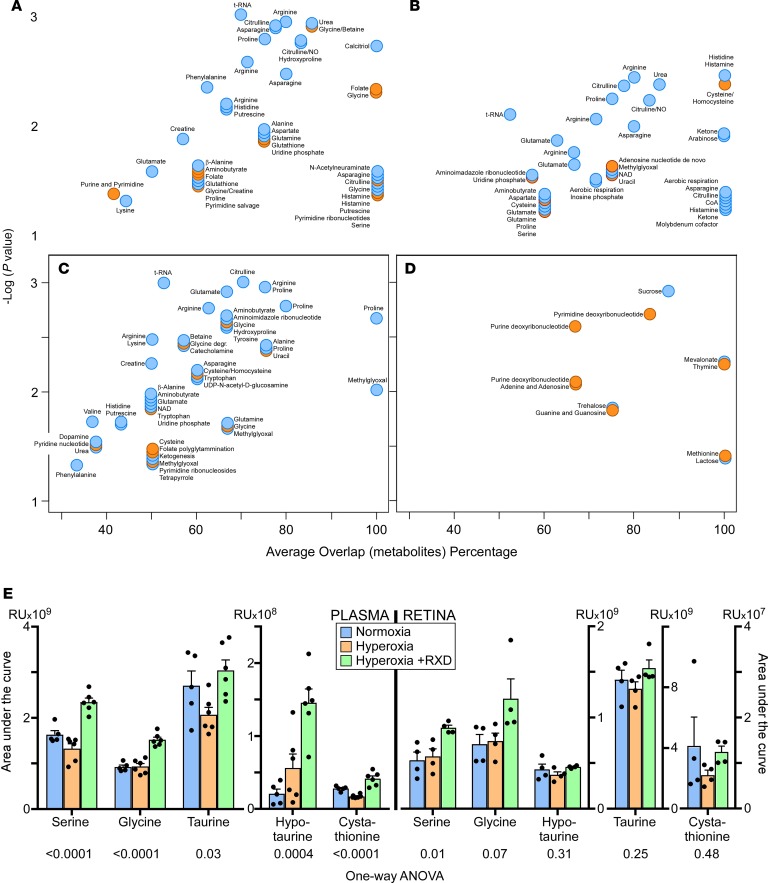
Figure 2. Pathway cloud plot depicting various metabolic pathways affected by RXD.
All the data in this figure are from mice dissected on postnatal day 10 (A–D), and bar graph of annotated metabolites (E) shows that PHi targets the serine/1C pathway. Metabolite features were analyzed through a pathway prediction algorithm in XCMS Online tool, and statistically significant pathways with P value less than 0.05 are depicted in these plots. Data were projected onto a mouse-specific database available on XCMS. Please also see pathway tables in Supplemental Tables 1–4. (A) Positive mode plasma data. (B) Negative mode plasma data. (C) Positive mode retina data. (D) Negative mode retina data. Serine /1CM metabolic pathways are highlighted in orange. Targeted data analysis was performed on a few metabolites from the serine/1C pathway. Identities of metabolites were confirmed using MS1 exact mass and MS2 fragmentation pattern. (E) Selected plasma metabolites (n = 6 for each condition) and retina metabolites (n = 4 for each condition). P values are shown below the x axis.

