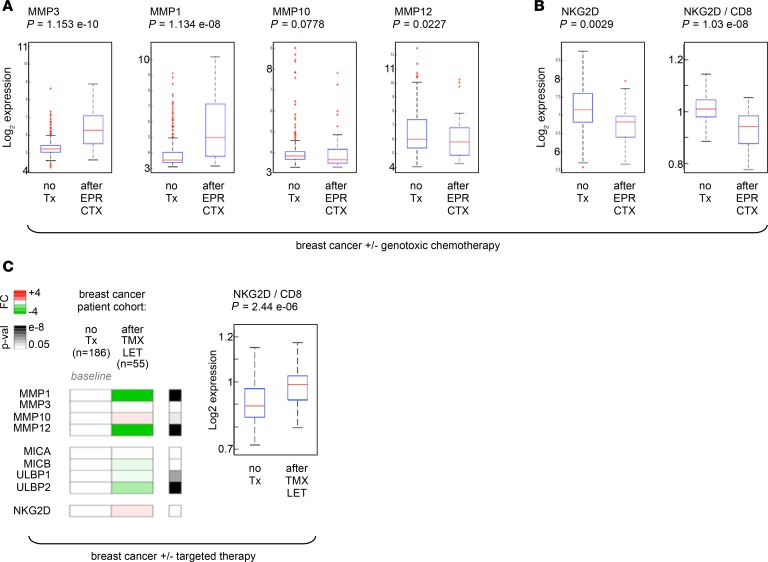
Figure 10. The coordinated upregulation of MMPs and downregulation of NKG2D occurs in breast tumors where NKG2D ligand–expressing SnCs persist after genotoxic chemotherapy, but not after targeted therapy.
(A and B) MMP and NKG2D expression in breast tumors from patients treated or not with genotoxic therapy (dose-intense epirubicin and cyclophosphamide regimen [EPR CTX]). Analyses and displays are explained in the Figure 1B legend. In the right panel in B, NKG2D receptor expression was further normalized to CD8 expression (significant decrease). (C) MMP, NKG2D ligand, and NKG2D expression in breast tumors from patients treated or not with non-DNA-damaging, targeted therapy. Patient cohorts were identified and analyzed using the same methods used for Figure 1B (see Methods). 186 untreated patients were compared with 55 patients who underwent tamoxifen (TMX) or letrozole (LET) estrogen receptor–targeted therapy. Results are displayed as color heatmaps of median-level expression of each gene in untreated (baseline) versus TMX/LET-treated (green-to-white-to-red scale indicates mRNA levels lower-to-equal-to-higher compared with untreated; details in Supplemental Figure 7, C and D). FDR P values (p-val) are displayed as a gray scale on the right. In the box plot, NKG2D receptor expression was further normalized to CD8 expression (significant increase). Box plot length: 25% and 75% of data; centerline: median; whiskers: 25% – (or 75% +) 1.5 × IQR, dots: outliers.

