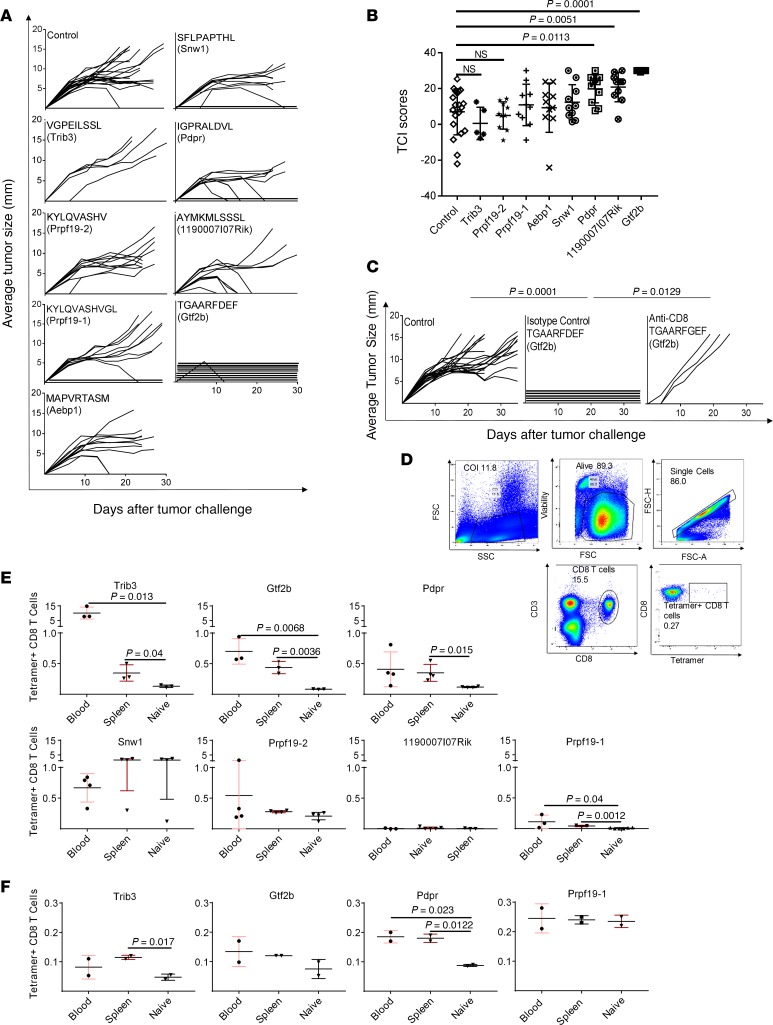
Figure 2. Tumor rejection and CD8+ tetramers elicited by immunization with neoepitopes.
(A) Naive BALB/cJ mice were immunized, as described in the Methods, with the 8 neoepitopes identified in Table 1, and were challenged with 95,000 Meth A cells. Tumor growth was measured. Each line represents tumor growth in a single mouse. (B) Total TCI scores for data in A. The maximum possible TCI score is 30. Each column shows the average total TCI score for the indicated treatment group. Error bars are shown above each column. P values for TCI scores comparisons were calculated using 1-way ANOVA test. Dunnett’s test was performed as a follow-up test to ANOVA to correct for multiple comparisons. The adjusted P values are reported. The experiment was repeated 3 or more times. (C) BALB/cJ mice were injected with CD8-depleting antibody (or isotype control) as described in the Methods. Immunization (with the indicated neoepitope) and tumor challenge were as in A. P values for comparison of the AUC scores were calculated using 1-way ANOVA. Tukey’s test was performed as follow-up test to ANOVA to correct for multiple comparisons. The adjusted P values are reported. (D) Gating strategy for splenocytes and blood cells of immunized mice stained for CD3, CD8, and tetramer. (E) Naive BALB/cJ mice were immunized with each of 7 indicated neoepitopes, and blood and spleen of individual mice were tested for presence of tetramer+ CD8+ T cells. In most instances, the responses shown for naive mice are the averages of the responses in blood and spleen, which were very similar to each other. P values for CD8+ T cell response comparisons were calculated using a 2-tailed t test. P < 0.05 was considered statistically significant. (F) Blood and spleen of individual non-immunized tumor-bearing BALB/cJ mice were tested for the presence of tetramer+ CD8+ T cells for the 4 neoepitopes in E, which elicited tetramer+ CD8+ T cells in immunized tumor-naive mice. P values for CD8+ T cell response comparisons were calculated using a 2-tailed t test. The experiment was repeated 3 or more times.

