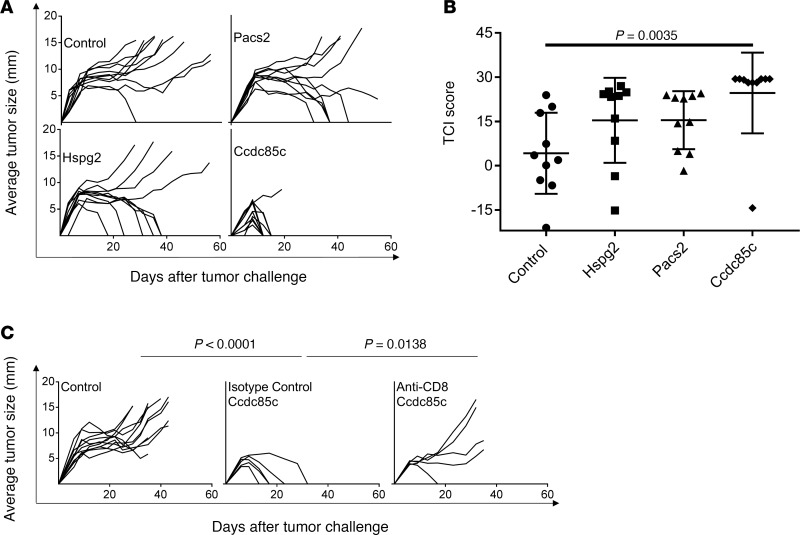
Figure 3. Tumor rejection elicited by immunization with low-abundance TRMNs.
(A) Naive BALB/cJ mice were immunized, as described in Methods, with the 3 neoepitopes identified in Table 2, and were challenged with 95,000 Meth A cells. Tumor growth was measured. Each line represents tumor growth in a single mouse. (B) Total TCI scores for data in A. Each column shows the average total TCI score for the indicated treatment group. Error bars are shown above each column. P values for TCI scores comparisons were calculated using 1-way ANOVA test. Dunnett’s test was performed as a follow-up test to ANOVA to correct for multiple comparisons. The adjusted P values are reported. The experiment was repeated 3 or more times. (C) BALB/cJ mice were injected with CD8-depleting antibody (or isotype control) as described in Methods. Immunization (with indicated neoepitope) and tumor challenge were carried out as in A. P values for comparison of the area under the curve (AUC) scores were calculated using 1-way ANOVA. Tukey’s test was performed as a follow-up test to ANOVA to correct for multiple comparisons. The adjusted P values are reported.

