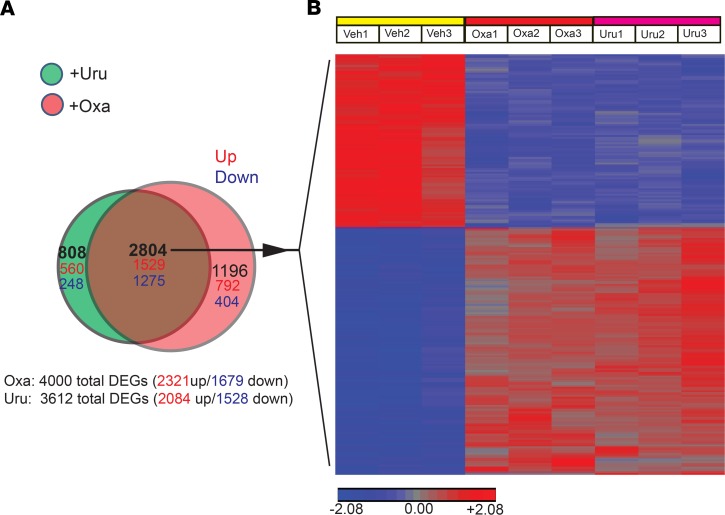
Figure 2. Whole-transcriptome microarray analysis of skin from oxazolone- and urushiol-induced ACD mouse models.
(A) Venn diagram showing the overlapping of DEGs between oxazolone- and urushiol-treated groups (red, upregulated; blue, downregulated). (B) Heatmap showing the common DEG (2804 genes) set shared by oxazolone- and urushiol-treated groups. n = 3 mice/group.

