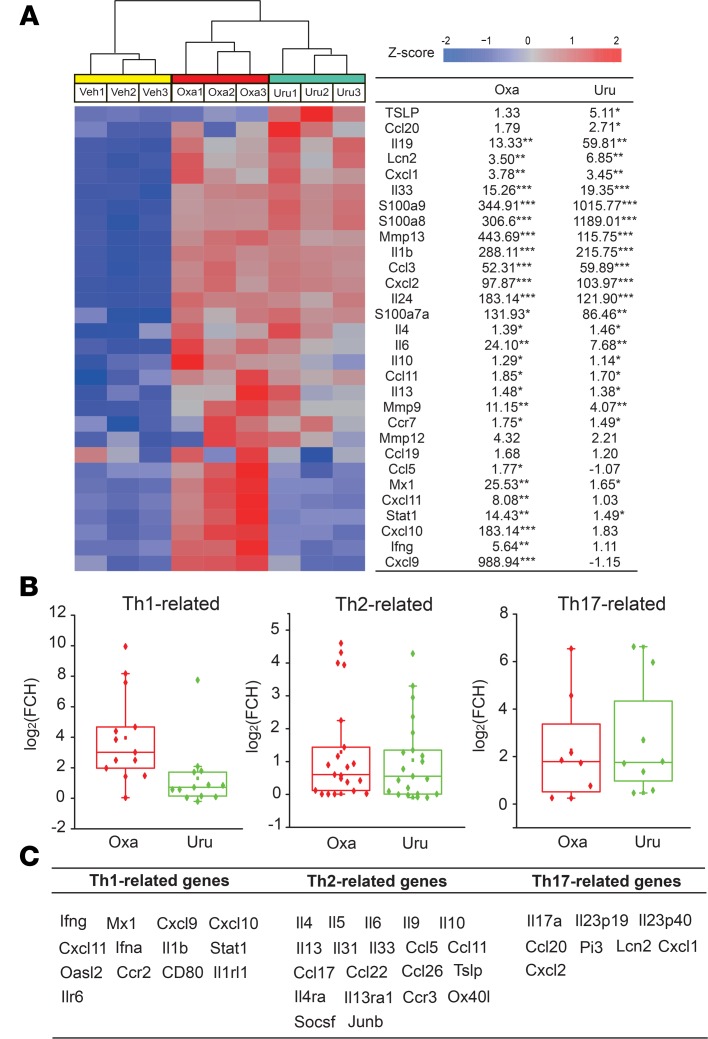
Figure 3. Common and unique DEGs in skin of oxazolone- and urushiol-treated groups compared with the vehicle group, identified by transcriptome microarray.
(A) Heatmap showing the expression of immune-related genes in mouse skin. Samples in the heatmap are grouped by treatments. (B) Box plots of representative gene expression changes across major immune pathways represented in transcriptome microarray. The box plots depict the minimum and maximum values (whiskers), the upper and lower quartiles, and the median. The length of the box represents the interquartile range. n = 3 mice/group. *P < 0.05, **P < 0.01, and ***P < 0.001 vs. control (acetone-treated) group. (C) The list of Th1, Th2 and Th17-related genes included in B.”

