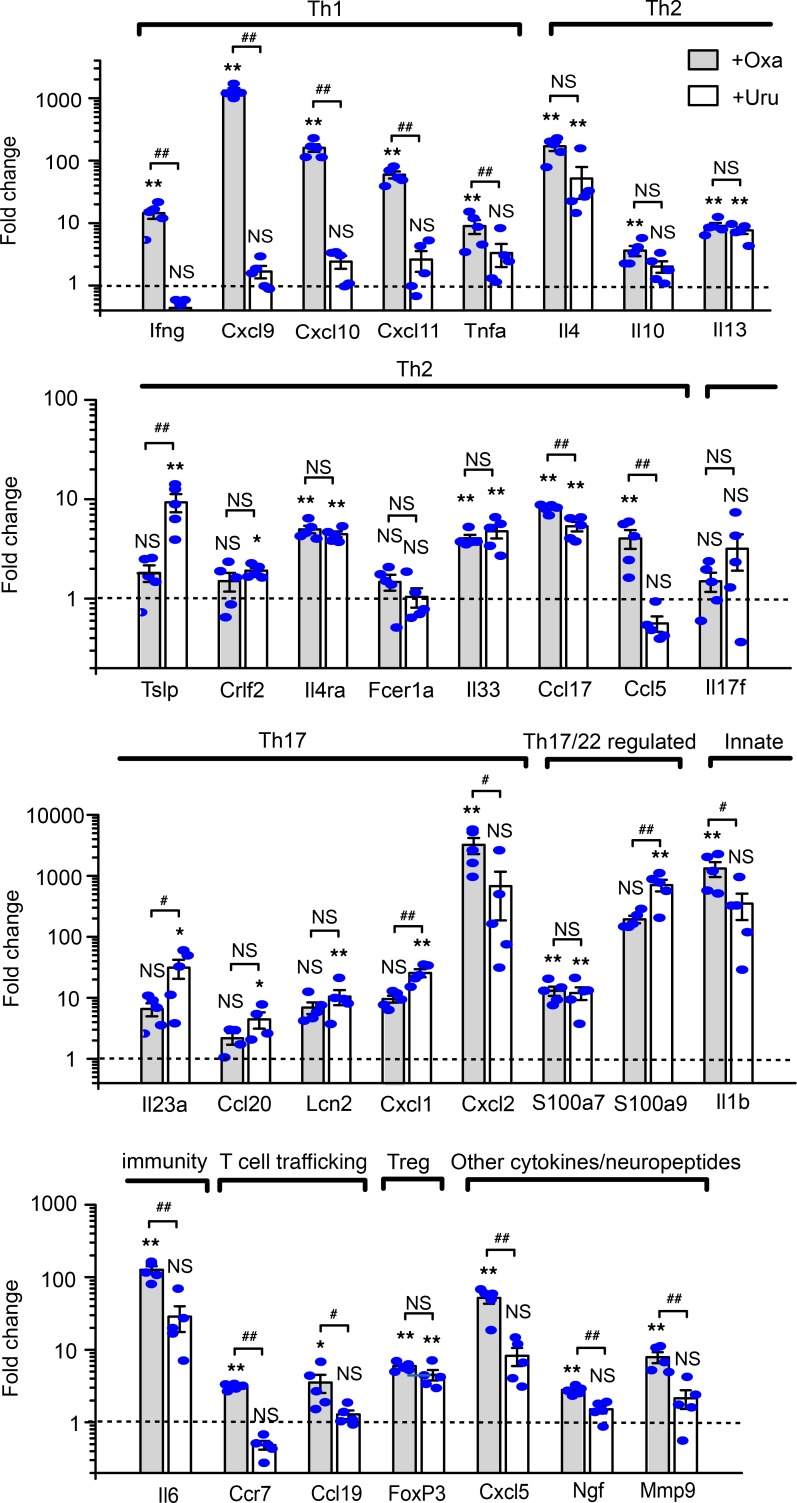
Figure 4. Validation of differential skin expression profiles of major cytokines and inflammatory marker genes in the oxazolone- and urushiol-induced ACD models.
Real-time TaqMan qPCR data were arranged according to the major inflammatory and regulatory pathways. Gene transcripts in skin samples of oxazolone-induced (gray column) and urushiol-induced (white column) ACD mice were compared to levels in respective vehicle control mice (not shown), as determined by TaqMan real-time qPCR. β-Actin transcript levels were used as an endogenous control. Data in bar graphs are expressed as mean ± SEM. n = 5 mice/group. *P < 0.05, and **P < 0.01 vs. vehicle control group; #P < 0.05, and ##P < 0.01 vs. urushiol group. NS, no significance. One-way ANOVA followed by Tukey’s post hoc test was used for statistical analysis.

