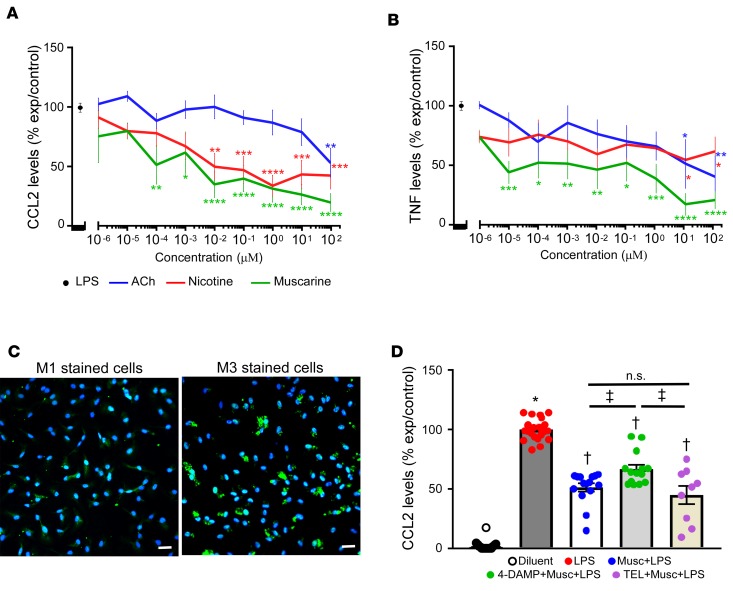
Figure 5. CCL2 and TNFs secretion in cultures of lipopolysaccharide-stimulated intraperitoneal macrophages.
(A) CCL2 protein levels in the supernatant of cultures of lipopolysaccharide-stimulated (LPS-stimulated) intraperitoneal macrophages (ipMACs) treated in the presence and absence of increasing concentrations of acetylcholine (ACh), muscarine, and nicotine (n = 3–14 biological replicates per group). (B) TNF protein levels in the supernatant of cultures of LPS-stimulated ipMACs treated in the presence and absence of increasing concentrations of acetylcholine, muscarine and nicotine (n = 3–9 biological replicates per group). Data are shown as percentage of experimental control (LPS) per concentration ± SEM, analyzed by 2-way ANOVA. For A and B, *P < 0.05, **P < 0.01, ***P < 0.001, ****P ≤ 0.0001 in comparison with LPS. The graphs were produced using GPLOT procedure of SAS. For each concentration in the x axis, the graph reports on the y axis the mean analyte level expressed as percentage of control (LPS) ± SEM. (C) Representative immunofluorescence staining of M1 and M3 ACh receptors in cultures of ipMACs. Scale bar: 20 μm. Green, M1 or M3; blue, DAPI. (D) CCL2 protein levels in the supernatant of cultures of LPS-stimulated ipMACs in the presence and absence of muscarine, 4-DAMP (M3 receptor antagonist), and telenzepine (M1 receptor antagonist, n = 9–24 biological replicates per group). Diluent, PBS. For D, *P < 0.0001 in comparison with LPS-treated cells; †P < 0.0001 in comparison with diluent (nonstimulated ipMACs) and LPS-stimulated cells; ‡P < 0.01 in comparison with cells treated with 4-DAMP, muscarine, and LPS. P value was calculated using 2-way ANOVA using generalized linear models procedure with the option ADJUST = TUKEY to account for any missing values in A and B and with 1-way ANOVA followed by the Tukey post hoc test for D.

