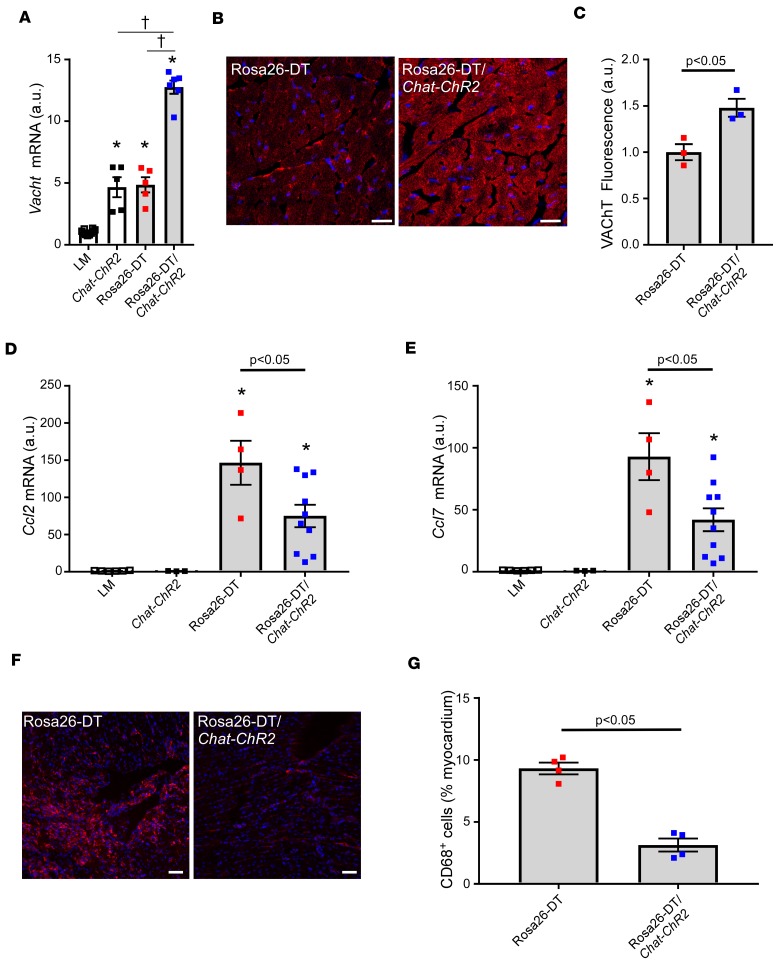
Figure 6. Effect of VAChT overexpression in the heart following diphtheria toxin–mediated injury.
(A) Vacht mRNA levels in the hearts of littermate (LM), Chat-ChR2 mice, diphtheria toxin–injected (DT-injected) Rosa26-DTMlc2v-Cre (Rosa26-DT), and Rosa26-DTMlc2v-Cre/Chat-ChR2 mice on day 3 after DT injection (n = 5–10 hearts/group). (B) Representative VAChT immunofluorescence staining in DT-injected (day 3) Rosa26-DTMlc2v-Cre and Rosa26-DTMlc2v-Cre/Chat-ChR2 hearts. Scale bar: 20 μm. (C) Group data of VAChT expression by immunofluorescence staining in DT-injected (day 3) Rosa26-DTMlc2v-Cre and Rosa26-DTMlc2v-Cre/Chat-ChR2 hearts (n = 3 hearts/condition). (D and E) Ccl2 and Ccl7 mRNA expression in the hearts of DT-injected (day 3) LM, Chat-ChR2, Rosa26-DTMlc2v-Cre, and Rosa26-DTMlc2v-Cre/Chat-ChR2 mice (n = 3–10 hearts/group). (F) Representative immunofluorescence staining of CD68+ cells in DT-injected Rosa26-DTMlc2v-Cre and Rosa26-DTMlc2v-Cre/Chat-ChR2 hearts on day 5 after DT administration. Scale bar: 50 μm. (G) Group data of CD68+ cells in DT-injected Rosa26-DTMlc2v-Cre and Rosa26-DTMlc2v-Cre/Chat-ChR2 hearts on day 5 after DT injection (n = 4 hearts/group). *P < 0.05 in comparison with LM, †P < 0.05 in comparison with Rosa26-DTMlc2v-Cre/Chat-ChR2. P values were calculated with 1-way ANOVA followed by the Tukey post hoc test for A, D, and E and Student’s t test for C and G.

