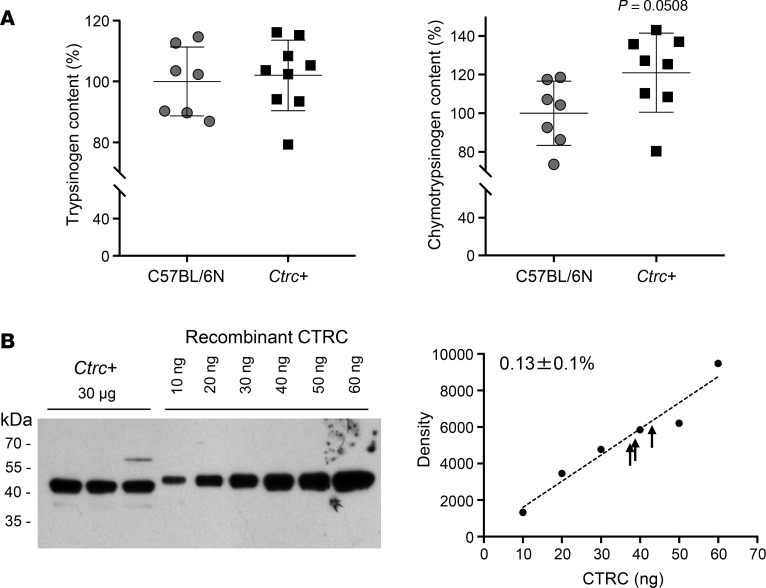
Figure 2. Protease zymogen levels in the pancreas of Ctrc+ mice.
(A) Total trypsinogen and chymotrypsinogen content of pancreas homogenates (n = 7–9). Individual data points with mean and SD are shown. The difference of means was analyzed by 2-tailed, unpaired t test. (B) CTRC protein levels in the Ctrc+ mouse pancreas assessed by Western blotting. Samples of pancreatic homogenates loaded contained 30 μg total protein. Purified, His-tagged, recombinant mouse CTRC was used as calibration standards. Note the slightly higher migration due to the tag. The right side indicates the densitometry of the Western blot. The recombinant CTRC protein amount was plotted as a function of density. The arrows point to the density values of the Ctrc+ homogenates. The percentage value is the average CTRC content of mouse pancreas homogenates (mean ± SD). Representative gel and densitometry from 2 independent experiments are shown.

