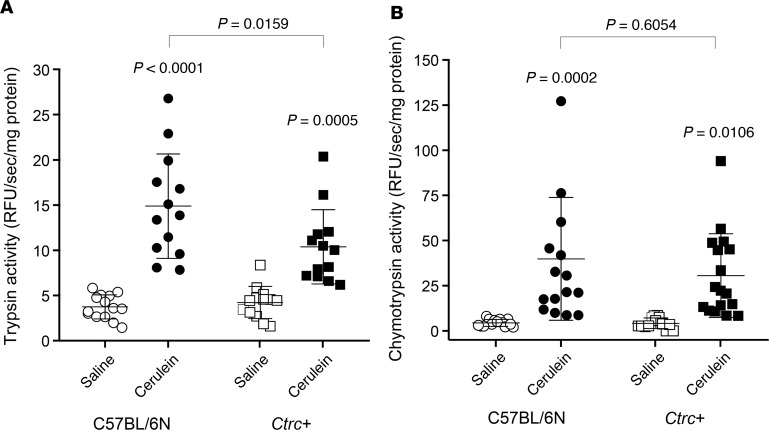
Figure 8. Intrapancreatic protease activation in Ctrc+ mice.
Trypsin (A) and chymotrypsin (B) activities were determined 30 minutes after a single saline (n = 13–14) or cerulein (n = 13–17) injection. Individual data points with mean and SD are shown. Statistical comparison of means was performed by 1-way ANOVA and Tukey’s post hoc test. See Methods for assay description.

