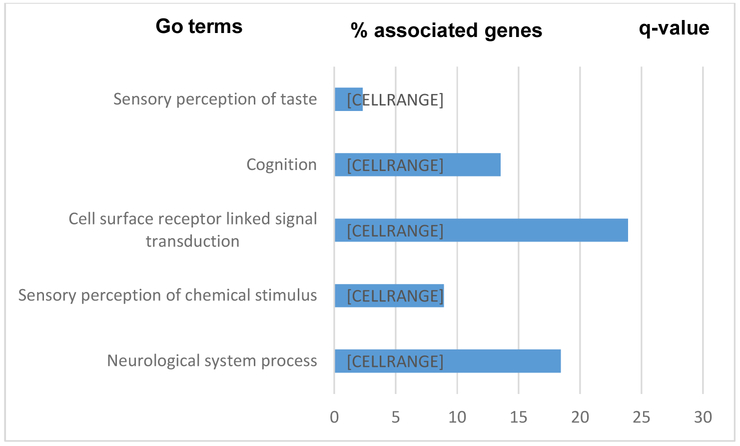
Figure 6.
Significant GO categories identified by the functional annotation tool in DAVID for NFTs. Only GO terms with a gene count >10 and q-value <0.05 are shown. Blue bar represents the percent of each gene set occurred in the identified DhMR genes submitted to DAVID. The q-value of the corresponding term are shown at the right end.

