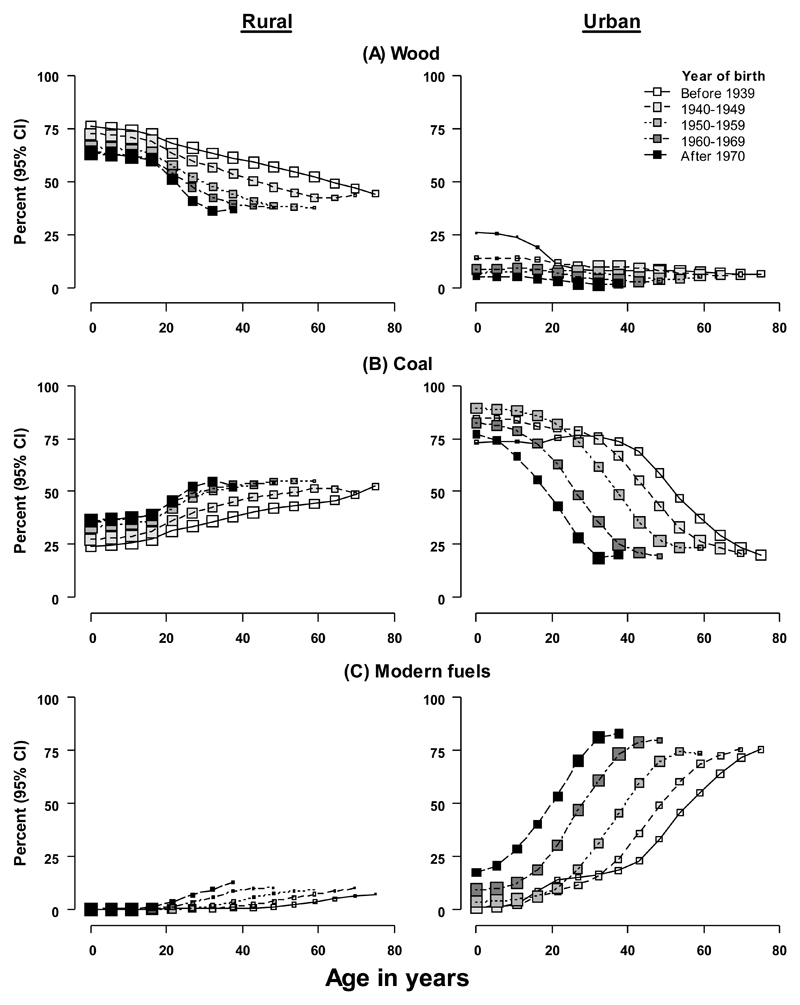
Figure 4. Adjusted percentage of length of age band exposed to specific heating fuel by five birth cohorts in rural and urban areas.
Left panels: rural areas; right panels: urban areas. Percentage estimates were adjusted for gender and regions. Size of boxes is inversely proportional to the standard error of the respective age band; 95% CI are too narrow to be seen in most graphs. Clean fuel includes gas, electricity and district heating. Note that the last box of each line (except for the one of ‘before 1939’, which was excluded due to the small sample size in this 75-79 age band) is the time point when the baseline survey was conducted (2004-08).

