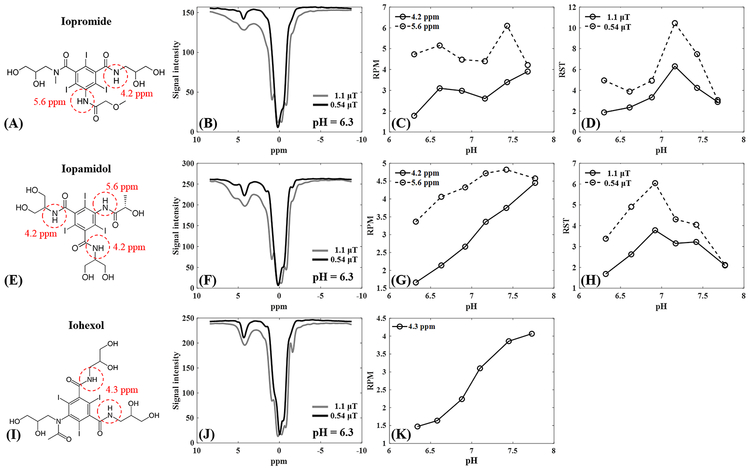
Figure 2.
Comparison between iopromide, iopamidol and iohexol at 35°C. The first row shows the chemical structure (A), Z-spectrum at pH = 6.3 (B), RPM values at both 4.2 and 5.6 ppm (C) and RST values at both 0.54 and 1.1 μT (D) for iopromide. The second row shows the chemical structure (E), Z-spectrum at pH = 6.3 (F), RPM values at both 4.2 and 5.6 ppm (G) and RST values at 600° and 300°(H) for iopamidol. The third row shows the chemical structure (I), Z-spectrum at pH = 6.3 (J) and RPM values at both 4.3 ppm (K) for iohexol. RPM = ratio of RF power mismatch, RST = relative saturation transfer, ppm = parts per million.

